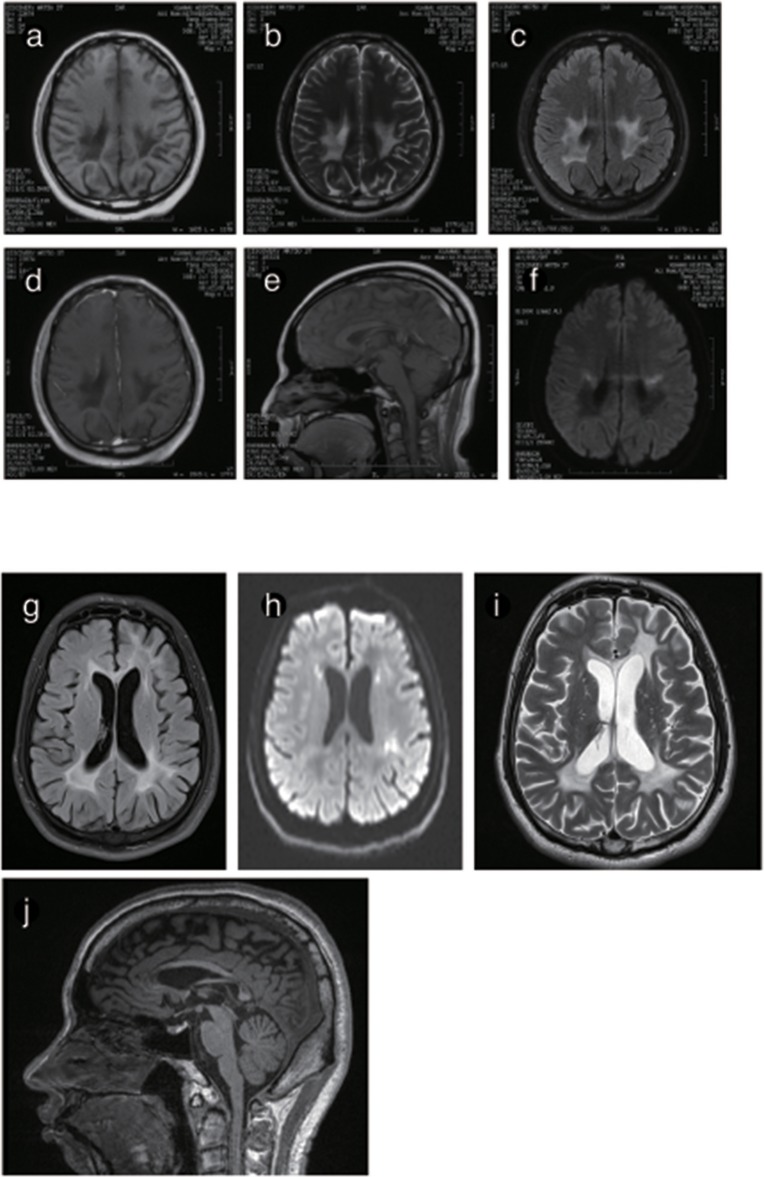
Figure 6.
Representative images from patient P4 and P5's brain MRI. (a) Axial MRI shows decreased signal intensity on Tl-weighted images, increased signal intensity on T2-weighted images (b) and a predominant FLARE signal in periventricular areas with no enhancement (c) or ring-like enhancement after contrast injection (d). (e) The sagittal T1-weighted image shows multiple hypointense lesions in the postural area of the corpus callosum. (f) The ADC image shows a periventricular diffusion restricted signal. (g) Axis FLARE image shows asymmetrical patchy lesions and inhomogeneous cerebral white matter abnormalities in the regions around the lateral ventricle (h). The posterior areas of the periventricular white matter show restricted diffusion (i). (j) The sagittal T1-weighted image shows that the anterior and posterior segments of the corpus callosum are affected.

