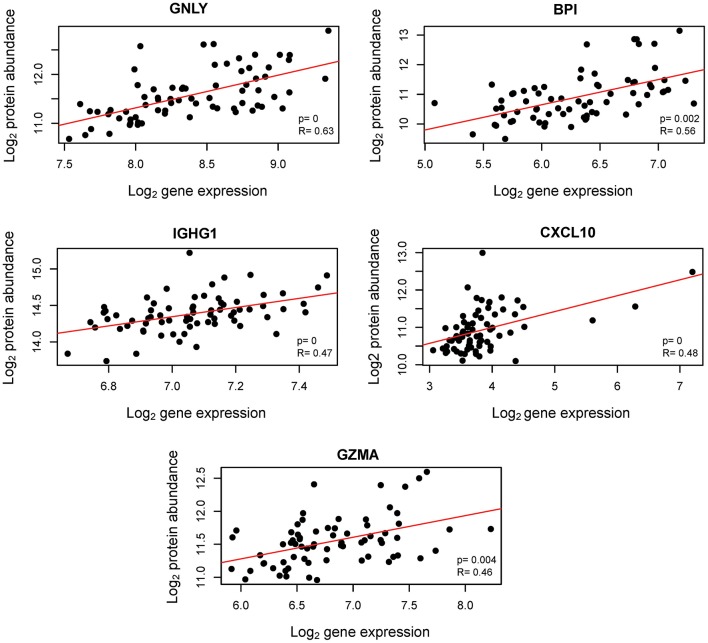
Figure 6.
Correlation between cellular transcriptome and maternal plasma proteome throughout normal pregnancy. Aptamer-based protein abundance measurements are plotted against mRNA expression. R: naïve Spearman correlation coefficient; p: likelihood ratio test p-value from linear mixed-effects models assessing the linear correlation accounting for repeated measurements from the same subjects.

