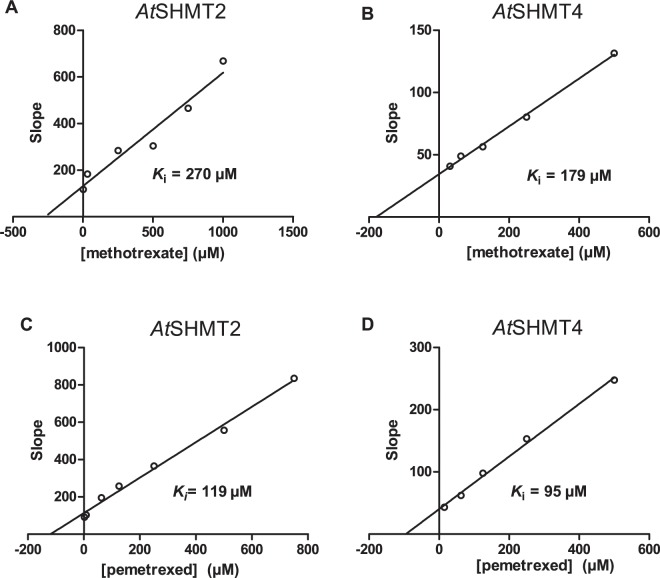
Figure 3.
AtSHMT2 and AtSHMT4 inhibition by MTX and PTX. Panel (A) shows data for AtSHMT2 inhibition by MTX; (B) AtSHMT4 by MTX; C, AtSHMT2 by PTX; D AtSHMT4 by PTX. Secondary plots of slopes as functions of antifolate concentrations were obtained from fitting of inhibition data (Fig. S2). Intercept on the X-axis gives an estimate of the inhibition constant (Ki) related to antifolate binding to the enzyme-glycine complex. Since it is known that the mitochondrial matrix has an alkaline pH (pH 868) as compared to the cytosol (pH 7.368), inhibition measurements were performed in 20 mM KPi buffer at pH 8.0 for AtSHMT2 and pH 7.3 for AtSHMT4 at 30 °C. Measurements were carried out varying 5-formyl-THF concentration, while keeping glycine at 10 mM and antifolates at different fixed concentrations. Units of slopes are μM.

