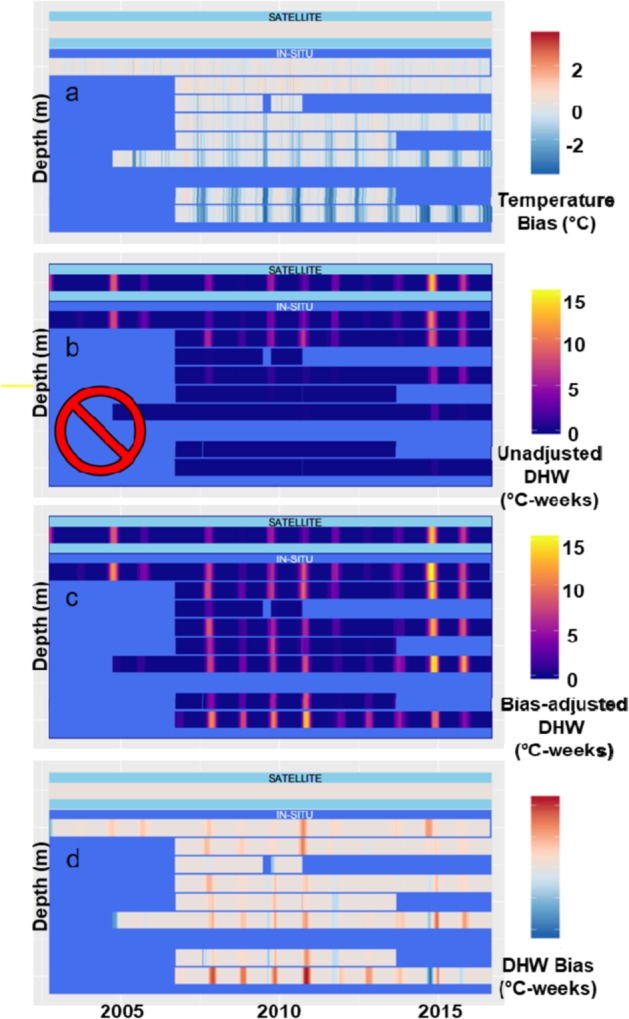
Figure 4.

An example results of the new method of using bias-adjusted MMM to estimate DHW at depth of 38 m at Pearl & Hermes Atoll site between 2002 and 2016 (depths binned every 5 m, n = 30). (a) In situ (STR) temperature bias relative to satellite (SST) data (red = STR warmer, blue = STR cooler). (b) Subsurface DHW at depth using unadjusted MMM threshold (inappropriate in situ DHW calculation identified with red prohibition sign). (c) Subsurface DHW using bias-adjusted MMM threshold. (d) Difference between surface and bias-adjusted subsurface DHW (red indicates surface DHW is greater and blue indicates surface DHW lower than subsurface DHW).
