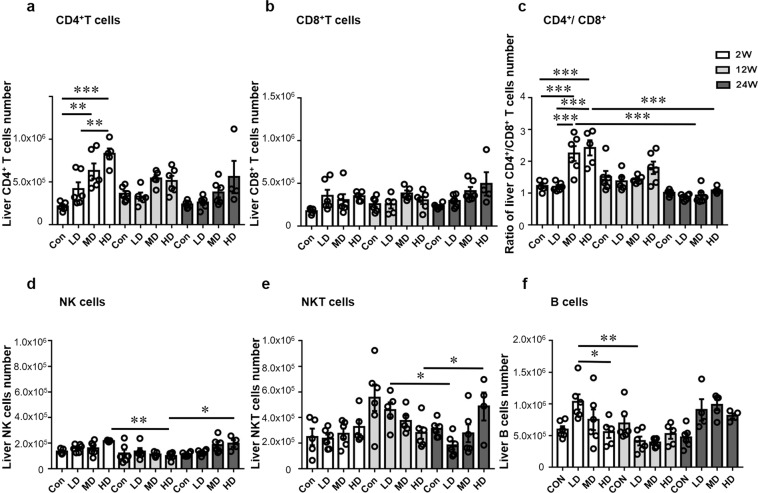
Figure 3.
Inflammatory cell subsets in the liver of mice infected during the course of infection. (a) Absolute quantification of hepatic CD4 (NK1.1−CD3+CD4+) T cells. (b) Absolute quantification of hepatic CD8 (NK1.1−CD3+CD8+) T cells. (c) Ratio of CD4+ T cells/CD8+ T cells in the liver. (d) Absolute quantification of hepatic NK (NK1.1+CD3−) cells. (e) Absolute quantification of hepatic NKT cells. (f) Absolute quantification of hepatic CD19+ B cells. LD: 50 PSCs; MD: 500 PSCs; HD: 2000PSCs. Data are shown as mean ± standard error of the mean (SEM, 4–6 mice per group), *p < 0.05, **p < 0.01 and ***p < 0.001.

