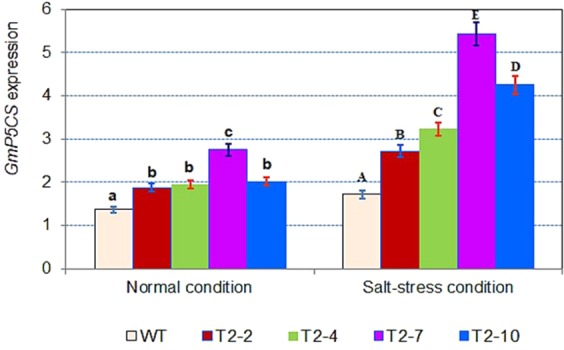
Figure 4.

The expression pattern of the GmP5CS gene in the four GM lines of the T2 generation and the non-transgenic plants (WT) as determined by qRT-PCR. Actin (152 bp) was used as the reference gene. WT: Wild-type; T2-2, T2-4, T2-7 and T2-10: GM soybean lines in T2 generation. The different letters above the columns indicate statistically significant differences (P < 0.05) as measured by Duncan’s tests. The data represents the mean of three biological replicates ± standard error.
