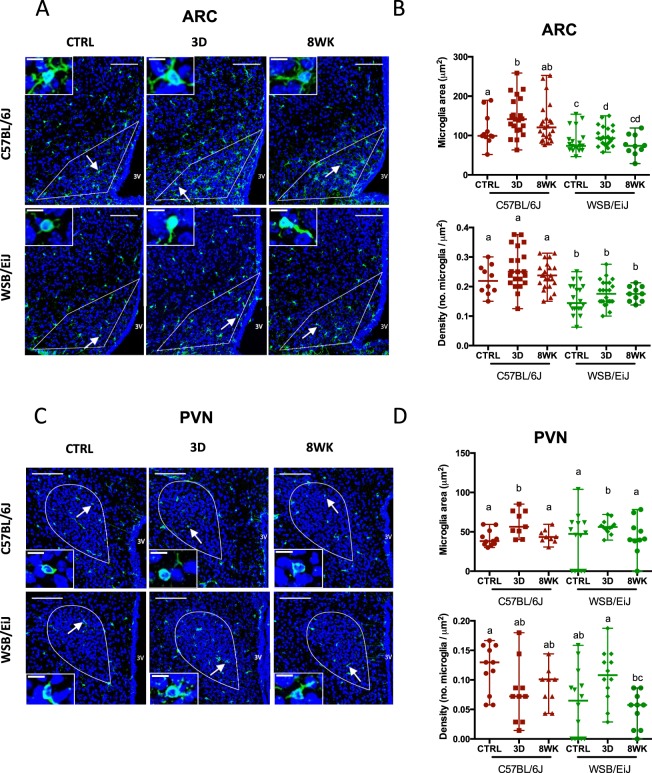
Figure 5.
WSB/EiJ mice show no increase of inflammatory responses to HFD in the hypothalamic arcuate nucleus (ARC) in contrast with C57BL/6J mice, but comparable responses in the hypothalamic paraventricular nucleus (PVN). Immuno-histochemical analysis of microglia cells in the hypothalamic nuclei of twelve old C57BL/6J and WSB/EiJ male mice either maintained under control feeding (CTRL), or challenged with HFD for the last 3 days of the period (3D) or during the whole 8-week experiment duration (8WK). (A) Representative confocal images of ARC immune-labelled with Iba1 (in green), a microglia marker, and DAPI-stained nuclei (in blue), in coronal sections of C57BL/6J (top panel) and WSB/EiJ (bottom panel) mice. Regions of interest (ROI) are delimited in white. Microglia pointed by arrowhead were magnified in insets at the top left of the main image; (B) Quantitative analysis of microglia area (top; soma + ramifications, in µm2) and density (bottom; number of microglia per µm2 of ROI) obtained from confocal images showed in A (N = 10–24 sections/group). Graphs show median values with range in scatter dot plot. Significant differences are indicated by different letters to account for between strain and between diet group differences (P ≤ 0.05; GLM); (C) Representative confocal images of PVN immune-labelled with Iba1 (in green), a microglia marker, and DAPI-stained nuclei (in blue), in coronal sections of C57BL/6J (top panel) and WSB/EiJ (bottom panel) mice. Regions of interest (ROI) are delimited in white. Microglia pointed by arrowheads were magnified in insets at the bottom left of the main image; (D) Quantitative analysis of microglia area (top; soma + ramifications, in µm2) and density (bottom; number of microglia per µm2 of ROI) obtained from confocal images showed in C (N = 10–24 sections/group). Graphs show median values with range in scatter dot plot. Significant differences are indicated by different letters to account for between strain and between diet group differences (P ≤ 0.05; GLM); Scale bars in main images: 100 µm; scale bars in insets = 10 µm.

