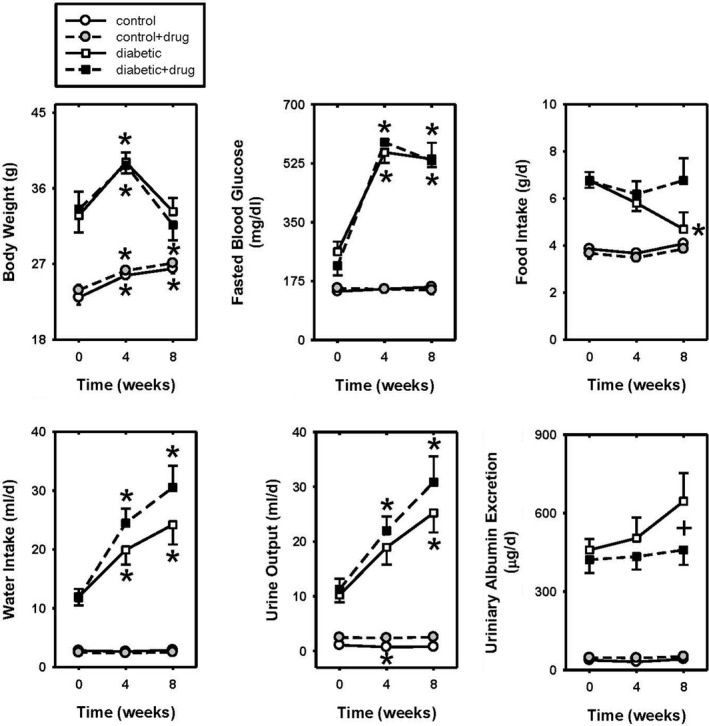
Figure 1.

The body weights (a), fasted blood glucose (b), food intake (c), water intake (d), urine output (e), and urinary albumin excretion (f) at time zero and during 4 and 8 weeks of vehicle or chymase inhibitor infusion in control (n = 11) and diabetic (n = 13) mice. Data are means ± SEM; *p < .5 versus time zero of same group; +p ≤ .05 vehicle‐treated diabetic versus chymase inhibitor‐treated diabetic
