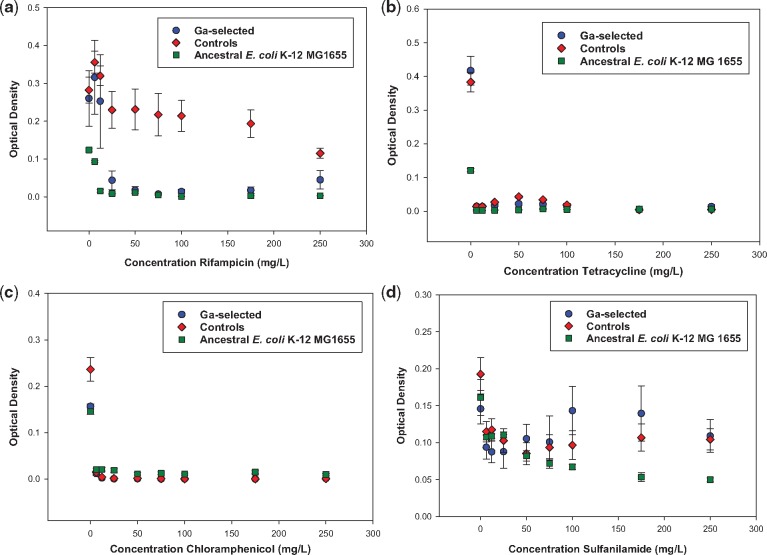
Figure 2.
(a) The mean and SE of 24-hour growth for populations in increasing concentration of rifampicin to 250 mg/l after 10 days of evolution. The controls from 25 to 250 mg/l were significantly > then the Ga3+-selected populations. The Ga3+-selected > ancestral from 6 to 25 mg/l and were equivalent from 50 to 250 mg/l. (b) The mean and SE of 24-hour growth for populations in increasing concentration of tetracycline to 250 mg/l after 10 days of evolution. The controls, Ga3+-selected and ancestral populations effectively showed no growth from 6 to 250 mg/l. (c) The mean and SE of 24-hour growth for populations in increasing concentration of chloramphenicol to 250 mg/l after 10 days of evolution. There was effectively no growth and no difference between the Ga3+-selected populations, controls and the ancestors from 6 to 250 mg/l. (d) The mean and SE of 24-hour growth for populations in increasing concentration of sulfanilamide to 250 mg/l after 10 days of evolution. There was no difference between the Ga3+-selected, controls and ancestral populations from 6 to 75 mg/l; however, the Ga3+-selected = controls and both were significantly > than the ancestral populations from 100 to 250 mg/l

