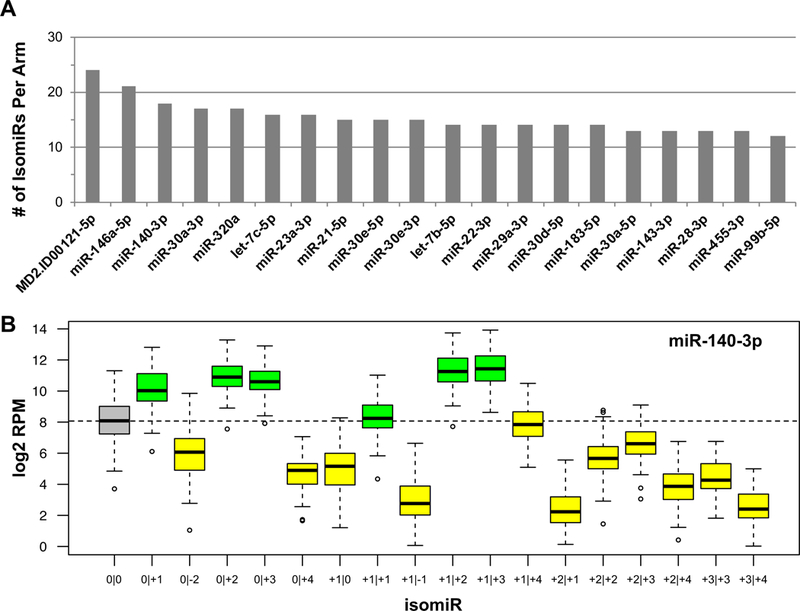
Figure 1: Profiling of UVM isomiRs.

(A) Each bar is a miRNA arm and the y-axis is the number of isomiRs produced at that locus. Shown are the top 20 producing loci. (B) An example of the expression of isomiRs from the miR-140–3p locus. The y-axis is a log2 RPM value for each individual isomiR. The grey box is the ‘0|0’ isomiR, green boxes indicate those isomiRs in which the median expression level is greater than the median expression level of the ‘0|0’ isomiR, while the yellow bars represents those isomiRs in which the median expression level is less than the ‘0|0’ isomiR. The dotted line shows the median expression of the ‘0|0’ isomiR.
