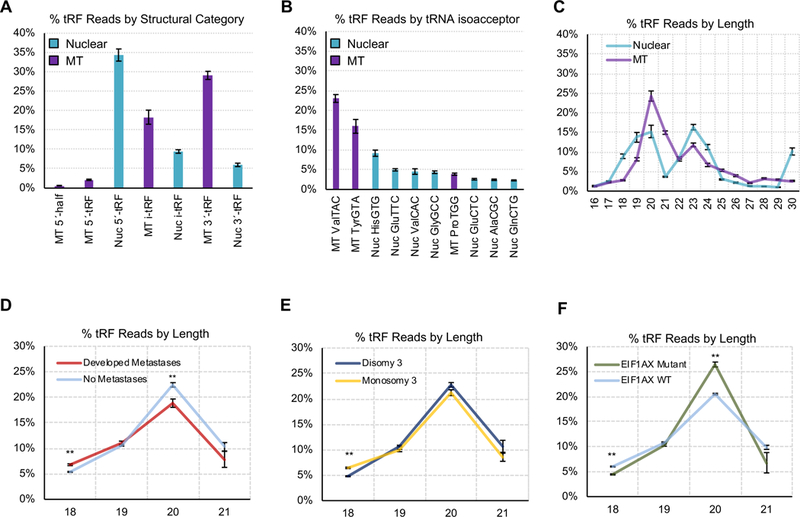
Figure 2: Profiling of UVM tRFs.

(A) Percentage of tRFs based upon the genomic origin - mitochondrial (MT) or nuclear (Nuc) - and structural type. Here, we show the sum of all reads of each structural type and genomic origin, as a percentage of the sum of all reads. (B) Percentage of tRF reads aligning to the different isoacceptors. Here, we show the sum of all reads from each isoacceptor, as a percentage of the sum of all reads. (C) Distribution of tRFs based upon read length for both nuclear and MT tRFs. Here, we compute the sum of tRFs of each length from 16–30nt, in each individual sample. We then convert these sums to percentages of the sum of reads in that sample, and plot the mean and standard deviations of each percentage for lengths 16–30nt, across all 80 UVM samples. We next analyzed tRF abundance as it relates to clinical characteristics. We show the % of tRFs at varying lengths (18–21 nts), by expression. In each plot, the x-axis shows tRF length (nt), while the y-axis is the percentage sum of sequence reads mapping to tRFs of each specific length. (D) Differentiates patients who did or did not develop metastasis, (E) differentiates M3 or D3 patients, and (F) differentiates patients with or without a mutation in either the EIF1AX or SF3B1 genes. P-values were determined by t-tests.
