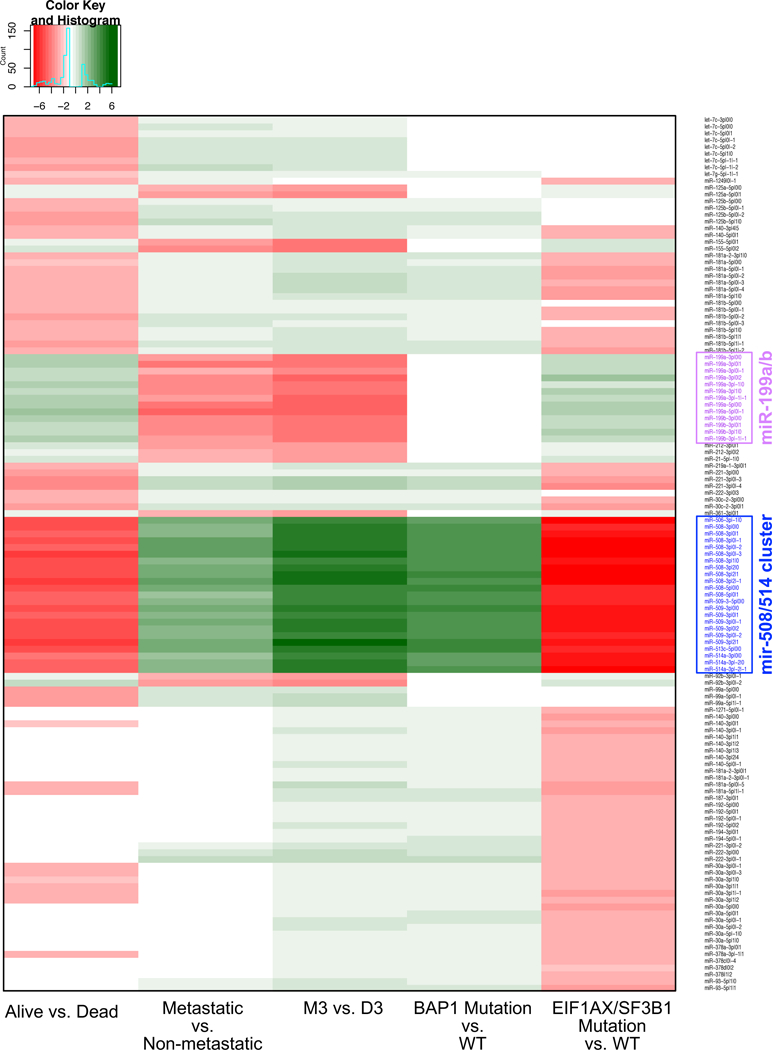
Figure 3: Differential abundance of isomiRs.

Heatmap showing the most differentially abundant isomiRs for the classification of UVM based upon different clinical attributes (columns): patients with or without a BAP1 mutation, M3 or D3 patients, patients who developed metastatic disease versus those who do not, patients with or without a mutation in either the EIF1AX or SF3B1 genes, and patients who have died versus those who were still alive at last clinical visit. Shown is the log2 of the fold change for each comparison. Each row represents a different isomiR. The isomiR labels highlighted in blue are those of the miR-508/514 cluster, and those highlighted in magenta are isomiRs of the miR-199a/b locus. White cells indicate that the isomiR was not DA for that particular comparison.
Red bars indicate those isomiRs with increased expression in the relevant category, while those isomiRs with decreased expression are represented by green bars. In each graph the x-axis represents a log2 of the fold change.
