Figure 2.

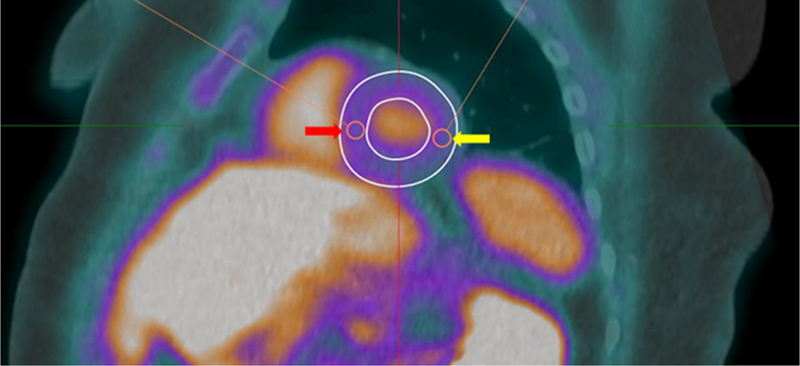
FDG PET/CT image analysis. The SUVmax for myocardium was measured using a three-dimensional ROI drawn in the mid-septal wall (red arrow) and mid-lateral wall (yellow arrow), avoiding areas of FDG spillover or abnormal FDG uptake.

FDG PET/CT image analysis. The SUVmax for myocardium was measured using a three-dimensional ROI drawn in the mid-septal wall (red arrow) and mid-lateral wall (yellow arrow), avoiding areas of FDG spillover or abnormal FDG uptake.