
Figure 6.
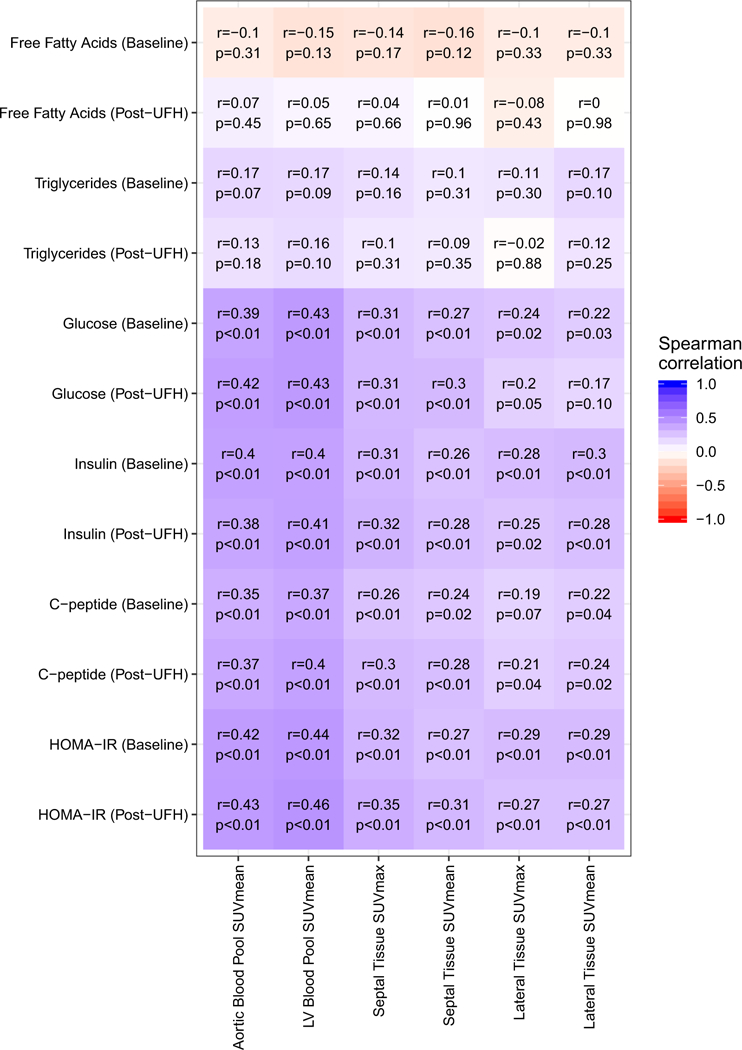
Heat map depicting correlation of biomarkers of glucose and fatty acid metabolism to blood pool and myocardial FDG uptake in diagnostic quality scans and excluding abnormal tissue ROIs.
Official websites use .gov
A
.gov website belongs to an official
government organization in the United States.
Secure .gov websites use HTTPS
A lock (
) or https:// means you've safely
connected to the .gov website. Share sensitive
information only on official, secure websites.
Heat map depicting correlation of biomarkers of glucose and fatty acid metabolism to blood pool and myocardial FDG uptake in diagnostic quality scans and excluding abnormal tissue ROIs.