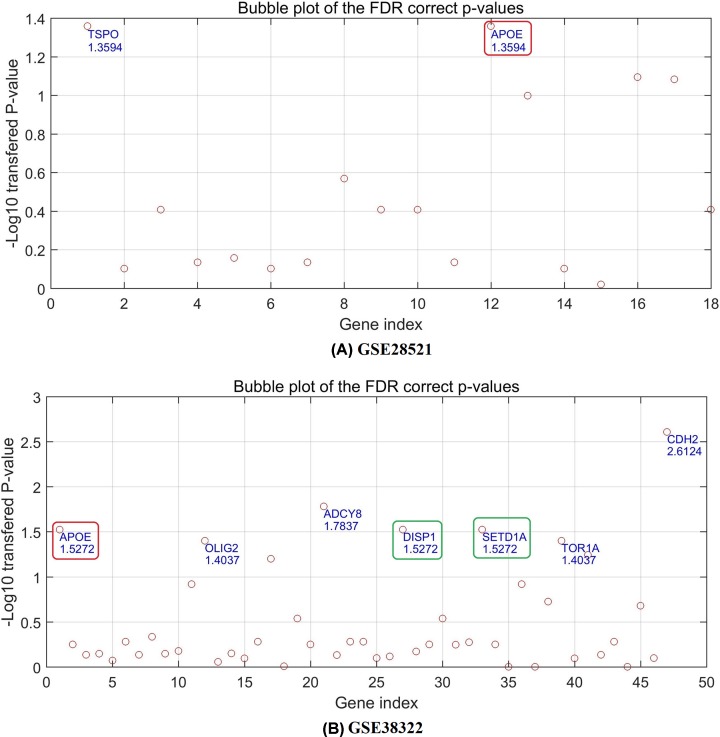
Figure 3. The P-values of the OCD individual genes for ASD case/control expression comparison in dataset GSE28521 and GSE38322.
(A) The P-values of the OCD-specific genes in dataset GSE38322. (B) The P-values of the OCD-specific genes in dataset GSE38322. The P-values have been through FDR correction with q = 0.05 and logic transformation using ‘−log10’. Names and corresponding transferred P-values of selected genes passed the FDR correction (q = 0.05) were marked at corresponding positions. The two genes (DISP1 and SETD1A) highlighted by green circle were newly identified by the 2019-based analysis, and the red-circle highlighted gene (APOE) was replicated in a 2018-published article.

