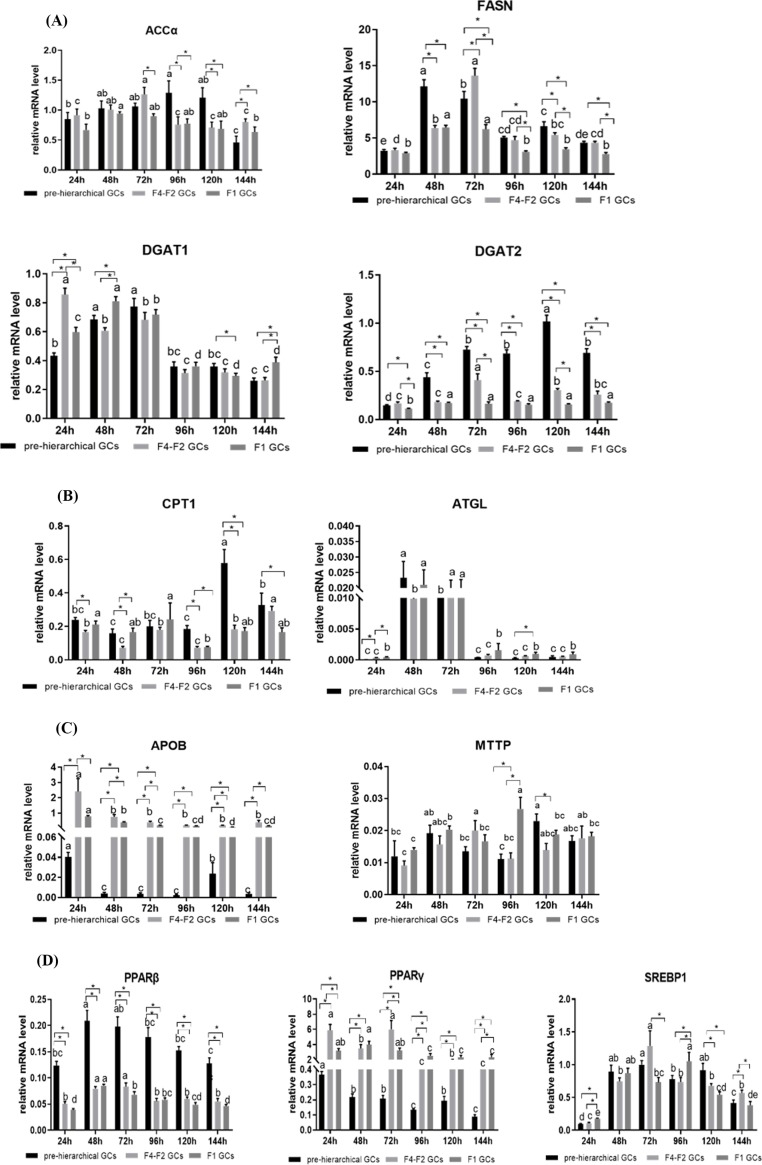
Figure 3. Expression patterns of genes involved in lipid metabolism in vitro culture GCs.
(A) Genes of lipogenic enzymes; (B) genes of lipolytic enzymes; (C) genes of lipid transport; (D) genes of transcription factors. Bars with different lowercase letters are significantly different for the same type of cell during the cultured time in vitro (P < 0.05). * indicates significant differences among GCs of three different stages in the same cultured time (P < 0.05). Data are presented as mean ± SEM (n = 3 replicate tanks). mRNA levels were normalized by β-actin and 18s.

