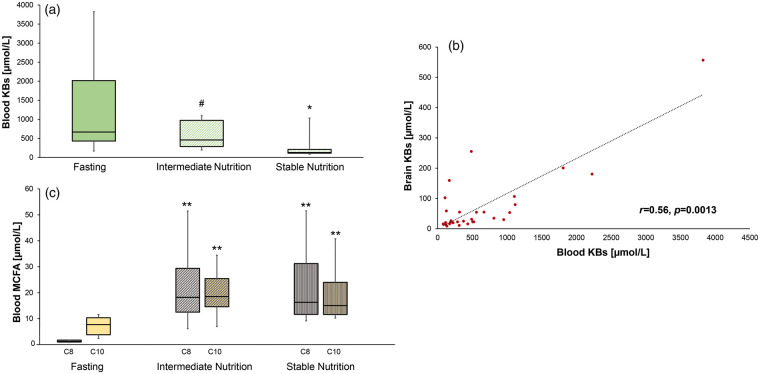
Figure 3.
Changes of total blood ketone bodies and free MCFA during nutrition. Concentrations of total plasma ketone bodies (KB, including acetoacetate [AcAc] and (β-hydroxybutyrate [BHB]); panel A) were measured in patients with TBI (n = 10; who received MCT enriched continuous enteral feeding) at baseline fasting vs. intermediate nutrition ((7.5 Kcal/kg) and stable nutrition (15 Kcal/kg)). Panel B illustrating the positive linear correlation between brain and blood KB (N = 30 samples from 10 TBI patients); Spearman’s rho linear correlation coefficient. Changes in the concentrations of plasma-free medium chain fatty acids (MCFA; C8 and C10) from fasting to nutrition are shown in panel C. Box-plots illustrate median (midline), 25–75th percentiles (lower and upper part of the boxes), 10–90th percentiles (lower and upper part of the whiskers). **p = 0.001; *p = 0.01; #p = 0.08 for comparison of fasting state vs. nutrition states.

