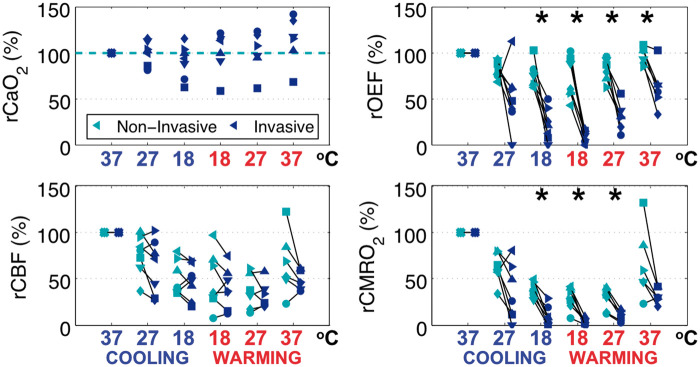
Figure 5.
Comparison of invasive versus non-invasive tissue sampling at each blood gas time-point demonstrate validity of optical assumptions of arterial concentration of oxygen (CaO2), agreement of relative cerebral blood flow (rCBF) measurements, but a discrepancy in relative oxygen extraction fraction (rOEF) and relative metabolic rate of oxygen (rCMRO2). Paired data at each time-point are displayed with a unique symbol for each subject (n = 7) colored by modality (i.e. non-invasive, green; invasive, blue), and the x-axis labeled by respective nasopharyngeal temperature with stage designated by color (i.e. cooling, blue; rewarming, red). Asterisks (*) denote significant differences (p < 0.01) in paired t-tests between invasive and non-invasive sampling.

