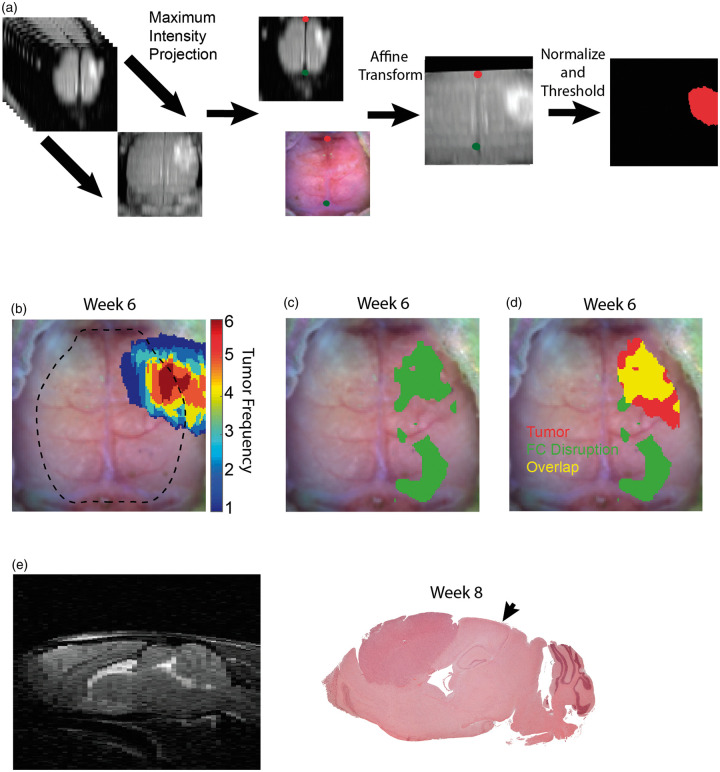
Figure 4.
MRI and OIS co-registration, tumor and disrupted functional connectivity overlay, and histology. (a) A maximum intensity projection of T2-weighted MRIs along the ventrodorsal direction was used to project MRIs onto the same plane as OIS, and affine transform was used to co-register the maximum intensity projection image and OIS using fiducial landmarks (the green and red dots indicate lambda and the intersection of the coronal and sagittal sutures, respectively). Images were then normalized and thresholded at 0.35. (b) Frequency map of brain tumors (n = 6) that were segmented from co-registered MRIs in sixth week post injection (dotted line indicates field of view of OIS). (c) Map of disrupted functional connectivity constructed by performing a pixel-wise t-test between fourth and sixth week post-injection group-average homotopic connectivity maps (n = 13, paired, p < 0.05, FDR corrected). (d) Overlay of the non-zero tumor frequency pixels masked by the FOV of OIS and map of disrupted functional connectivity. Overlay image demonstrates local and remote regions of functional connectivity disruption. (e) Hematoxylin and eosin stain of representative mouse injected with glioma cells in the eigth week post-injection (MRI provides orientation). Histology indicates that the tumors are well-circumscribed, localized to the injection site, and absent from the region of remote functional connectivity disruption (arrow indicates the remote region of functional connectivity disruption corresponding to the visual cortex).

