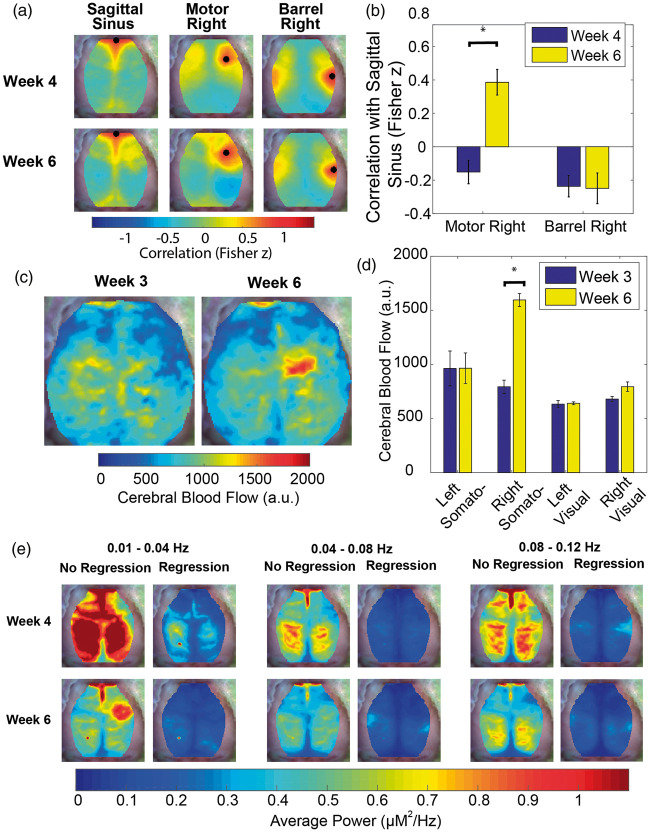
Figure 6.
Vascular dysregulation within the tumor region. (a) Group-average correlation maps (n = 13) of sagittal sinus, motor right and barrel right seeds at week 4 and week 6 post-injection. (b) Quantification of the group-average correlation (n = 13) between the sagittal sinus seed and both the motor right and barrel right seeds (*indicates p < 0.05). This graph indicates that regions near the injection site become correlated with systemic vascular fluctuations over time. (c) Group-average cerebral blood flow maps for a subset of mice (n = 3) at week 3 and week 6 post injection. (d) Quantification of the group-average cerebral blood flow value (n = 3) for the left and right somatosensory hindlimb and left and right visual seeds at week 3 and week 6 post-injection indicates that tumor blood flow increases over time. (e) Group-average power maps (n = 13) for three frequency bands with and without regression of the signal from a vascular feature (sagittal sinus seed) at week 4 and week 6 post-injection demonstrate that average power maps decrease in magnitude with time and with regression of the sagittal sinus. However, average power in the tumor region increases in the 0.01 Hz–0.04 Hz frequency band when there is no regression of the sagittal sinus. The power in the tumor region is affected more profoundly by sagittal sinus regression than other regions indicating that the hemodynamic in this region is likely being driven by vascular fluctuations of systemic origin.

