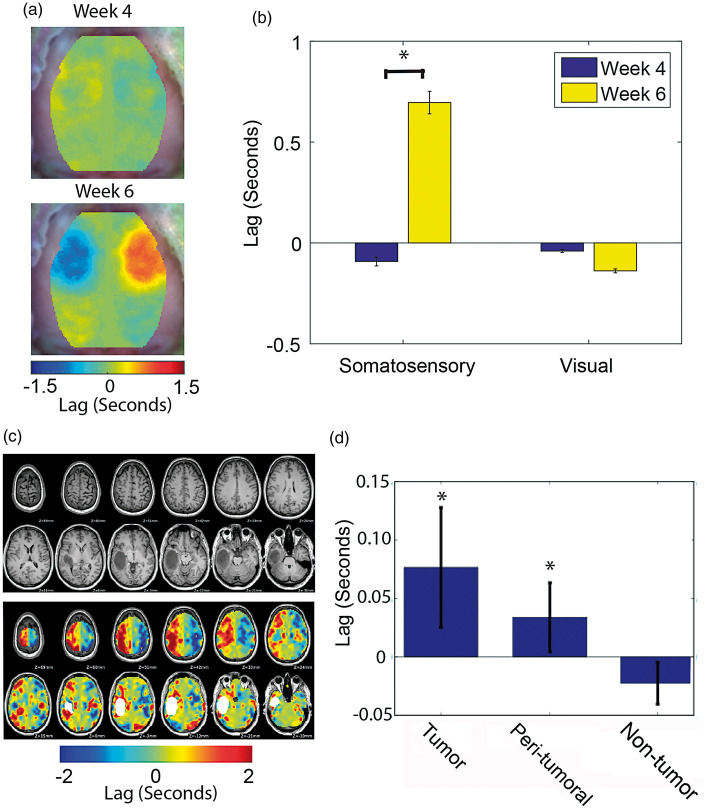
Figure 7.
Homotopic lags in mice and in humans. (a) Group-average homotopic lag maps for mice injected with glioma cells (n = 13) at week 4 and week 6 post injection. (b) Quantification of the group-average homotopic lag (n = 13) for the somatosensory forelimb and visual seeds (*indicates p < 0.05). These data indicate that murine tumor hemodynamics lag behind the homotopic brain region. (c) Structural MRIs and homotopic lags for a representative human case. (d) Quantification of the group-average homotopic lag (n = 27) for the tumor, peri-tumoral, and non-tumor brain regions (*indicates p < 0.05). Tumor and peri-tumoral regions, but not the non-tumor region, exhibit significant lags compared to their homotopic regions.

