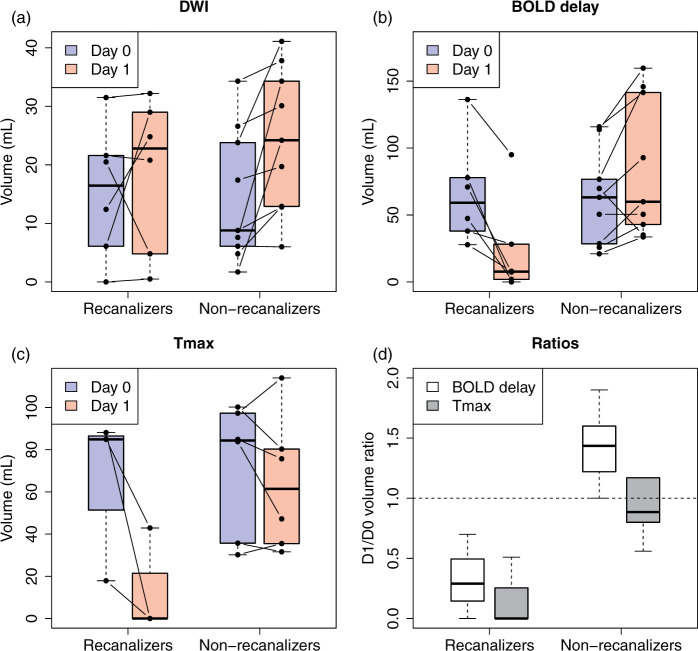
Figure 1.
Boxplots (central line; median, box; first and third quartiles, whiskers; ± 1.5*IQR) showing manually delineated DWI (a), BOLD delay (b), and Tmax (c) lesion volumes on day 0 and day 1 according to recanalization status. Changes in perfusion lesion volume in patients who did not recanalize (n = 6) and those who did recanalize (n = 3) at follow-up (d). D1/D0 volume ratios > 1 indicate perfusion lesion growth and values < 1 indicate shrinkage. Note that (a) and (b) show the entire sample, while (c) and (d) only show patients who also received DSC-MRI.

