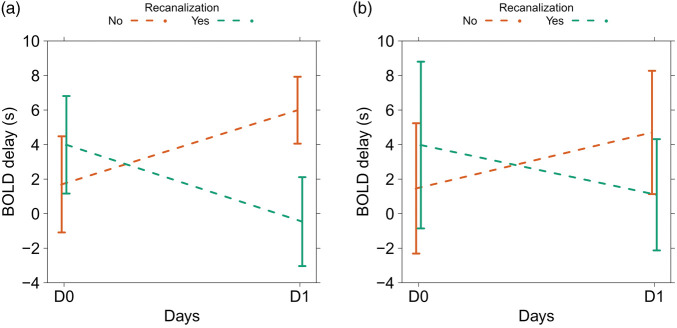
Figure 6.
Effects plots showing the predicted mean BOLD delay values (derived from the venous sinus reference in A and the healthy hemisphere reference in B) from the linear mixed models for the interaction between the study timepoints (D0 and D1) and the presence or absence of recanalization. The bars indicate 95% confidence intervals. The plots show that recanalization is associated with a decrease in BOLD delay severity, while persistent vessel occlusion is associated with an increase in BOLD delay severity in areas of infarct growth.

