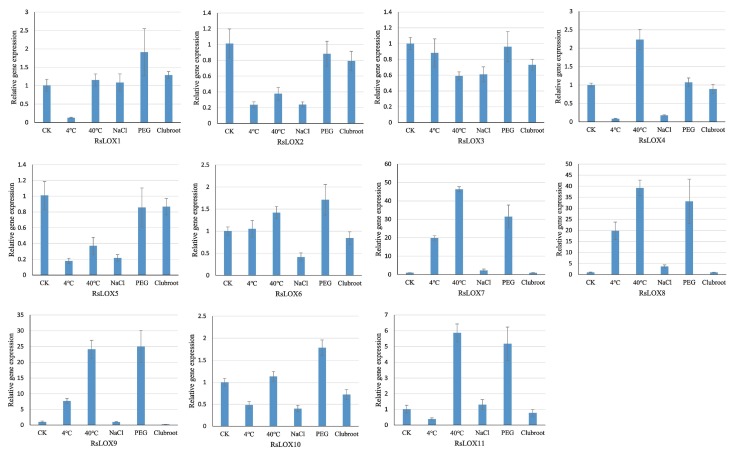
Figure 7.
Quantitative real-time PCR analysis of RsLOX expression levels in the roots under various abiotic and biotic stress conditions. The presented gene expression levels are relative to the expression of the reference gene. Data are presented as the mean ± standard deviation of three independent experiments. CK: control treatment.

