Figure 4.
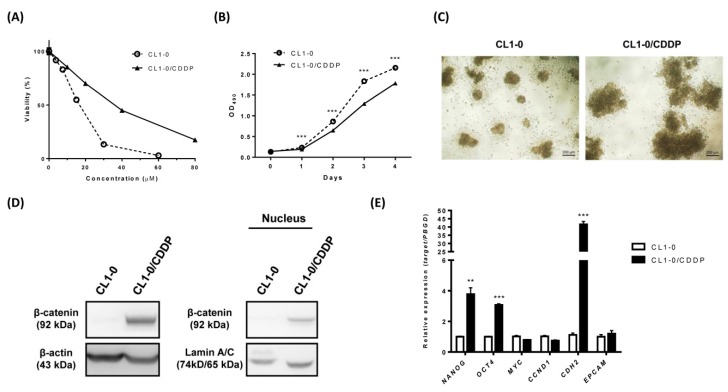
Nuclear β-catenin and cancer stem cell-related markers are upregulated in the cisplatin-resistant subpopulation of CL1-0 cells. (A) CL1-0 cells and the cisplatin-resistant subpopulation of CL1-0 (CL1-0/CDDP) cells were treated with increasing concentrations of cisplatin for 48 h. Cell viability was measured using an MTS assay. The IC50 values of cisplatin in CL1-0/CDDP and CL1-0 cells were 33.35 µM and 15.34 µM, respectively. (B) Cell viability was analyzed by an MTS assay in CL1-0 cells and the cisplatin-resistant subpopulation of CL1-0 cells. (C) Phase contrast images of CL1-0 cells and the cisplatin-resistant subpopulation of CL1-0 (CL1-0/CDDP) cells cultured in a 96-well ultralow-attachment plate under anchorage-independent, serum-free conditions with supplementation of growth factor and B27 for 30 days. (D) Total and nuclear expression levels of β-catenin in CL1-0 cells and the cisplatin-resistant subpopulation of CL1-0 (CL1-0/CDDP) cells were measured by Western blotting. β-Actin and Lamin A/C were used as internal controls. (E) The mRNA expression levels of NANOG, OCT4, MYC, CCND1, CDH2, and EPCAM in CL1-0 cells and the cisplatin-resistant subpopulation of CL1-0 cells were measured by qRT-PCR and were normalized using the PBGD gene. The data are expressed as the means ± SDs from three independent experiments. ** p < 0.01, *** p < 0.001 (Student’s t-test).

