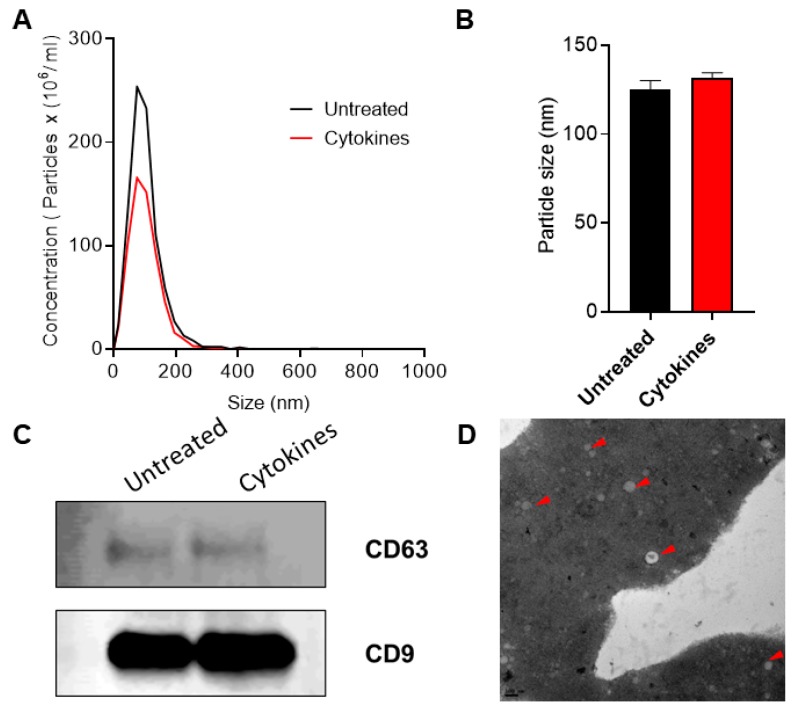
Figure 2.
Characterization of exosomes: nanoparticle tracking analysis was performed to profile extracellular vesicle (EV) particle concentration (A) and size distribution (B) in control and human cytokine-treated islet-derived exosomes (n = 3), (C) immunoblot was performed using antibodies against CD63 and CD9, and (D) TEM imaging was performed to confirm the presence of exosomes. Shown is a representative image of exosomes from untreated islets. Representative exosomes are indicated with a red arrow. Scale bar: 100 nm.

