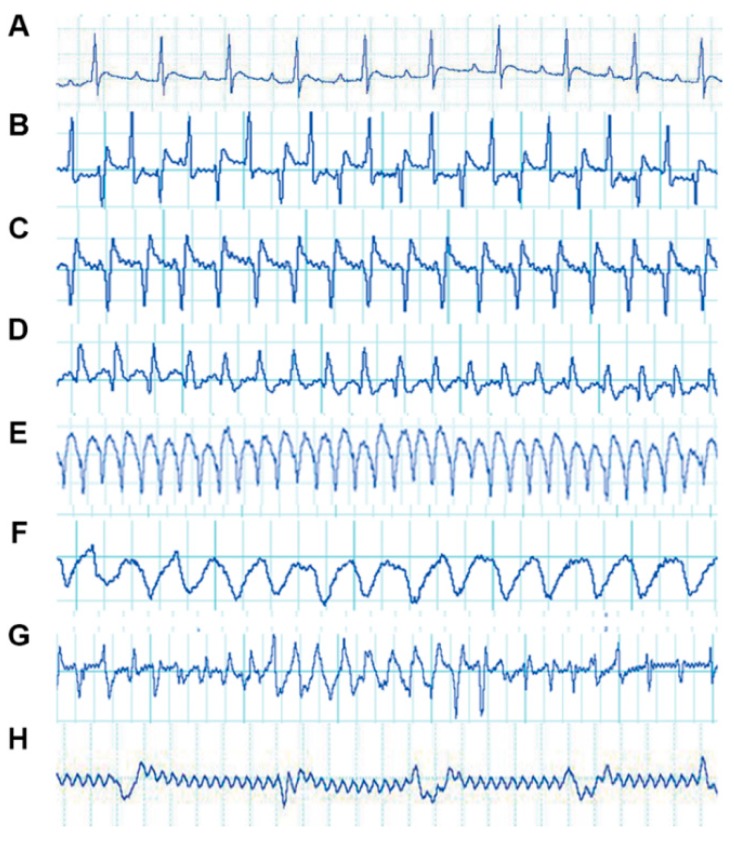
Figure 1.
Electrocardiogram (ECG) tracings of rats with ventricular arrhythmias (VA) induced by BaCl2. The vertical axis of each ECG indicates voltage (mV), with 0.5 mV for all grids. The horizontal axis of the ECG indicates time (s), with 0.2 s for all four grids: (A) normal rat ECG tracing; (B) supraventricular tachycardia (SVT); (C) ventricular tachycardia (VT); (D) myocardial ischemia; (E) ventricular flutter; (F) ventricular fibrillation (VF); (G) different types of arrhythmias switching between each other; and (H) a terminal ECG.

