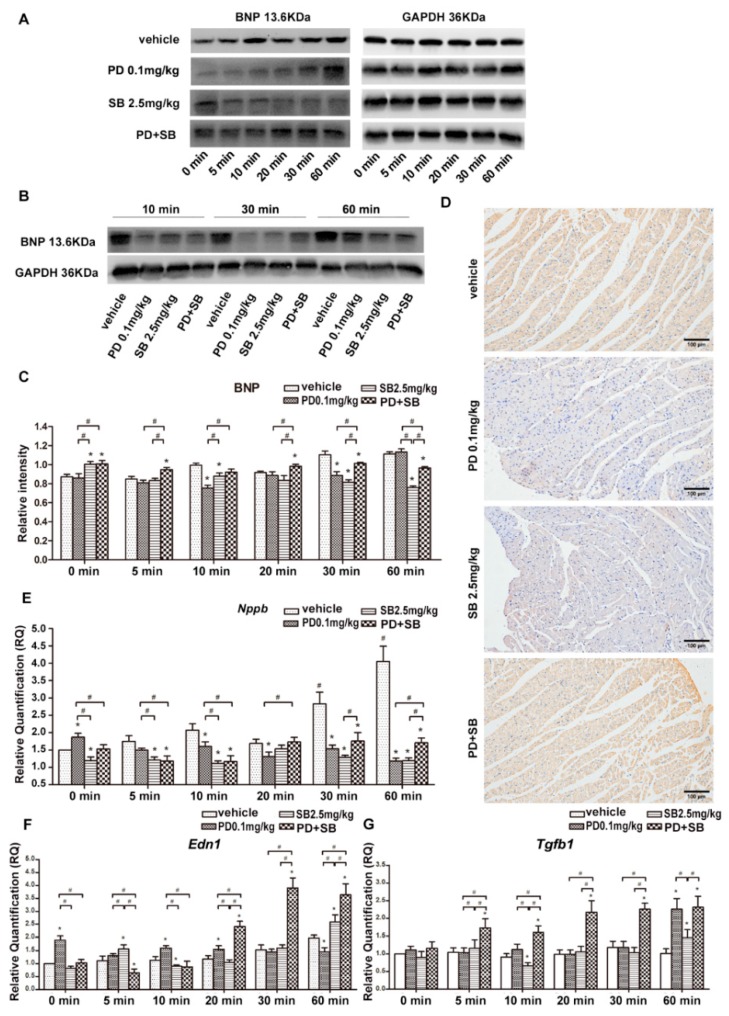
Figure 5.
Expression of brain natriuretic peptide (BNP) protein after the application of inhibitors. (A,C) Western blot and column graphs of BNP protein in myocardial tissues of rats in the vehicle group. PD 0.1 mg/kg, SB 2.5 mg/kg, or PD+SB groups by western blot analysis. (B) Western blot of BNP protein in myocardial tissues of rats with ventricular arrhythmia (VA) at 10, 30, and 60 min after intraperitoneal injection of vehicle, PD 0.1 mg/kg, SB 2.5 mg/kg, or PD+SB before VA. (D) Immunohistochemical (IHC) staining for BNP in myocardial tissues of rats with VA 30 min after intraperitoneal injection of vehicle, PD 0.1 mg/kg, SB 2.5 mg/kg, or PD+SB before VA. (E–G) The expression of Nppb, Edn1, and Tgfb1 after the application of inhibitors by real-time quantitative polymerase chain reaction (qPCR). PD, PD142893; SB, SB431542. * p < 0.05, vs. vehicle group. # p < 0.05, vs. same timepoint subgroup.

