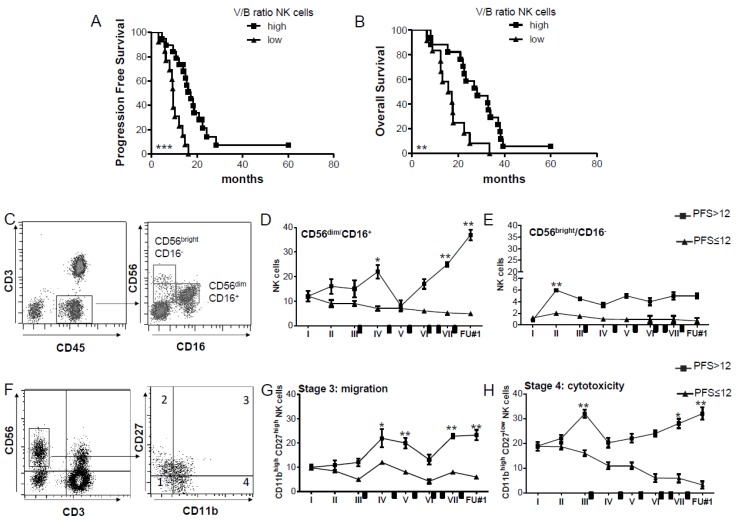
Figure 1.
CD56dim CD16+ NK cells with cytotoxic phenotype are prevalent in patients with PFS > 12. (A,B) Kaplan–Meier analysis curves of the correlation between V/B ratio of NK cell counts with (A) progression-free survival (PFS) and (B) overall survival (OS) (high V/B ratio > 2.1, n = 15 vs. low V/B ratio ≤ 2.1, n = 15). (C) Representative dot plots showing different subsets of NK cells based on the expression of CD56 as bright or dim and CD16. NK cells are gated in CD45+ CD3− cells. (D,E) Time course of frequency of (D) CD56dim and (E) CD56bright. NK cells measured by flow cytometry in PFS > 12 (n = 14) or PFS ≤ 12 patients (n = 16) (* p < 0.01, ** p < 0.005, vs. first vaccination, indicated as I). Data are presented as mean ± SEM. Black rectangles indicate temozolomide (TMZ) administration as maintenance. (F) Representative dot plot showing the four stages of NK cells by the flow cytometry evaluation of CD11b and CD27 expression. (G,H) Time course of frequency of NK cells from stage 3 or migratory stage (G), and stage 4 or cytotoxic stage (H) in PFS > 12 (black square, n = 14) or PFS ≤ 12 (black triangle, n = 16). (* p < 0.01, ** p < 0.005, vs. I vaccination). Data are presented as mean ± SEM. Black rectangles indicate TMZ administration as maintenance.

