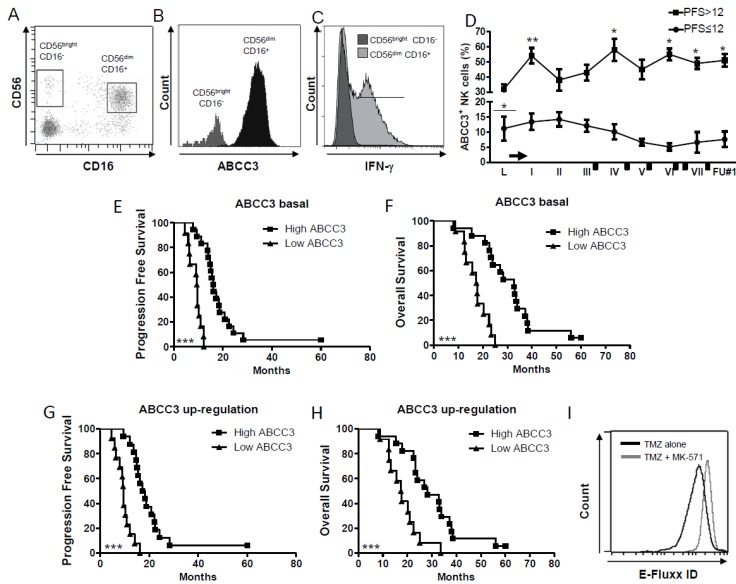
Figure 2.
ABCC3 expressed by CD56dim CD16+ NK cells is an indicator of better patient prognosis. (A–C). (A) Representative dot plots showing that CD56dim CD16+ NK cells express (B) high levels of ABCC3, (C) and CD56dim CD16+ ABCC3+ NK cells express IFN-γ. (D) Time course of frequency of NK cells expressing ABCC3 measured by flow cytometry (* p < 0.01, ** p < 0.005, vs. leukapheresis; underlined asterisk PFS > 12 vs. PFS ≤ 12). The arrow represents the standard Stupp protocol [3] after leukapheresis, before the first vaccination (indicated as I), and the black rectangles correspond to the TMZ administration as maintenance. (E,F) Kaplan–Meier survival curves showing the positive correlation between high basal ABCC3 expression in NK cells with (E) PFS and (F) OS. (G,H) Kaplan–Meier survival curves showing the positive correlation between ABCC3 upregulation during treatment with chemoimmunotherapy and better (G) PFS and (H) OS, (*** p < 0.001). (I). Flow cytometry displaying the multidrug resistance activity of NK cells treated in vitro with TMZ with or without the efflux inhibitor MK-571. Cells showing drug resistance have a MAF greater than 25%.

