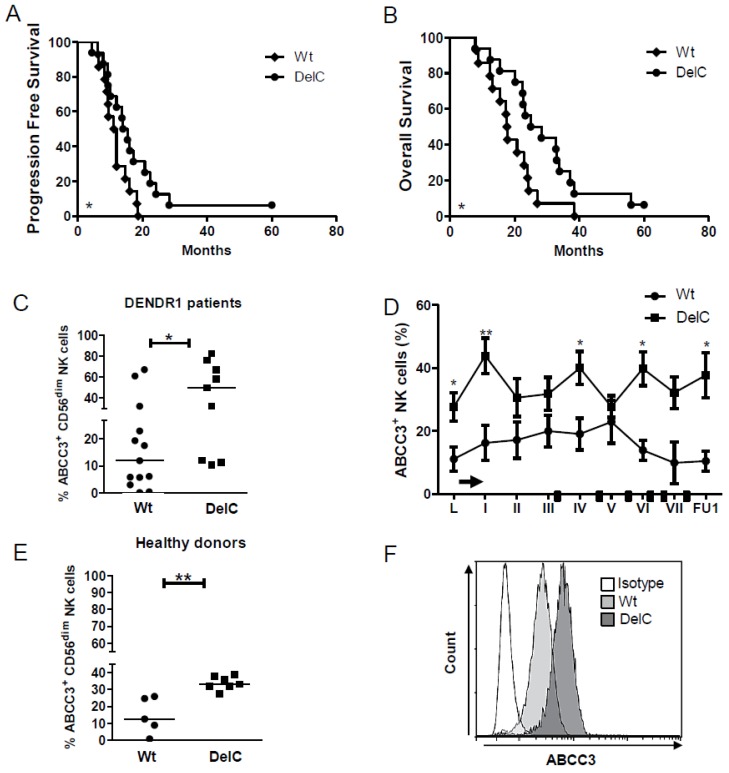
Figure 3.
DelC genetic variant is related to a better response to chemoimmunotherapy. (A,B) Kaplan–Meier survival curves showing the correlation between DelC SNP and a good outcome, expressed as (A) PFS and (B) OS (DelC patients, n = 14, Wt patients, n = 16). (C) Scatter dot plots showing the frequency of NK cells expressing ABCC3 in a total of 23 patients (Wt or DelC), at the time of leukapheresis (L). (D) Time course of NK cells expressing ABCC3 measured by flow cytometry in DENDR1 patients carrying DelC compared to Wt. (E,F). (E) Scatter dot plots showing the frequency of NK cells expressing ABCC3 in 13 healthy donors divided in Wt (n = 6) and DelC (n = 7). (F) Representative histogram overlays for flow-cytometric analysis of ABCC3 expression on NK cells from healthy donors. The isotype control is represented as white histogram plot. The specific fluorescent signals are shown in light grey for Wt donors and dark grey for DelC donors.

