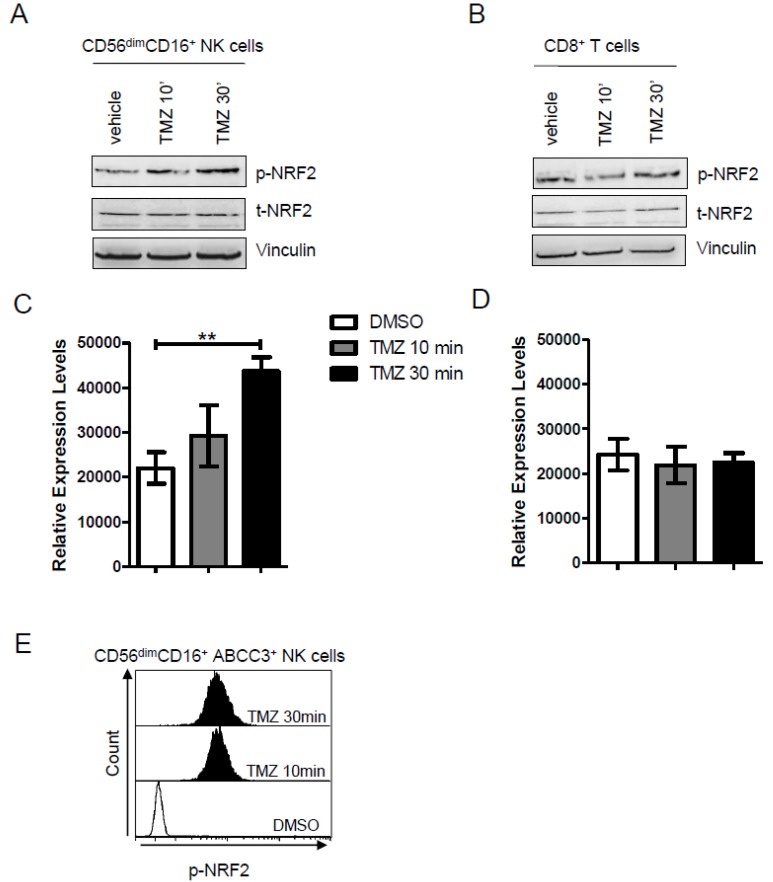
Figure 4.
(A,B) Representative western blot analysis performed on enriched (A) NK and (B) CD8+ T cells from donor PBLs showing that 25 μM of TMZ increased the activation of NRF2 (phosphoSer40) after 30 min of treatment. Vinculin was used as loading control. The immunoblot is representative of three experiments. (C,D) Densitometric quantification of p-NRF2 expression in NK cells and CD8+ T cells treated with DMSO or TMZ at two different time points. Data are presented as mean ± SD of three independent experiments at the two different time points (p = 0.004). (E). Flow cytometry stacked histograms showing intracellular staining of p-NRF2 in donor-derived CD56dim CD16+ ABCC3+. The DMSO treatment is represented as light grey histogram plot. The activation of NRF2 at 10 and 30 min is displayed in dark grey and black, respectively.

