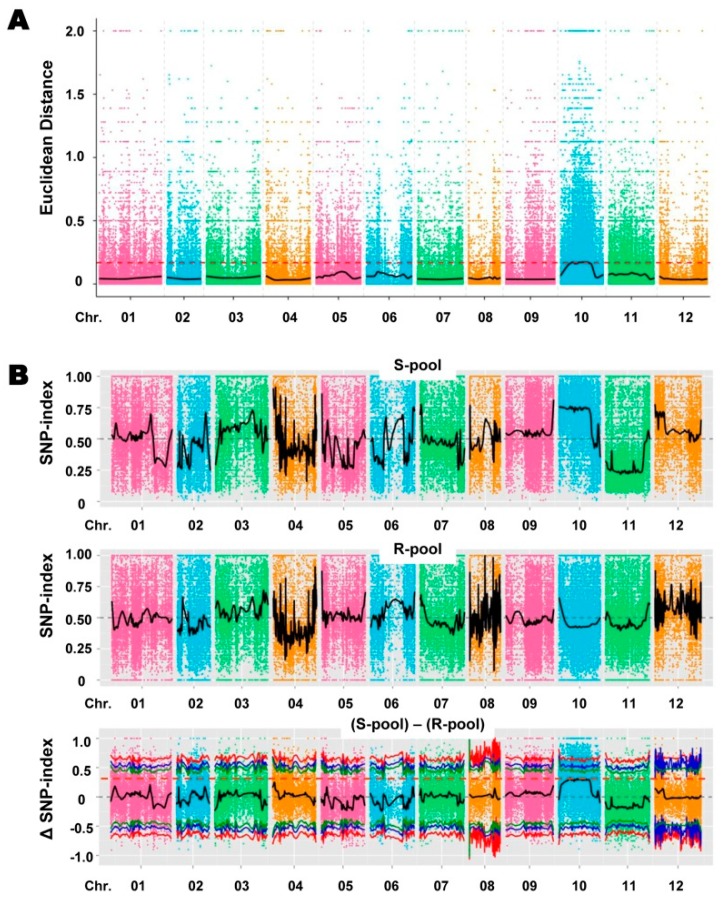
Figure 3.
Identification of genetic region(s) significantly associated with resistance to R. solanacearum strain Rs-SY1 in pepper (C. annuum) using combined specific-locus amplified fragment sequencing (SLAF-seq) and bulked segregant analysis (BSA). (A) Euclidean distance (ED)-based association results. The x-axis represents the 12 pepper chromosomes, and the y-axis represents the association values based on the ED at each SNP location. The red dashed line represents the association threshold. Higher association values based on the ED indicate a stronger association between the SNPs and bacterial wilt resistance. (B) SNP index graphs of the R- and S-pools, and the Δ(SNP index). The x- and y-axes indicate the 12 pepper chromosomes and the SNP index, respectively. The red dashed line represents the association threshold.

