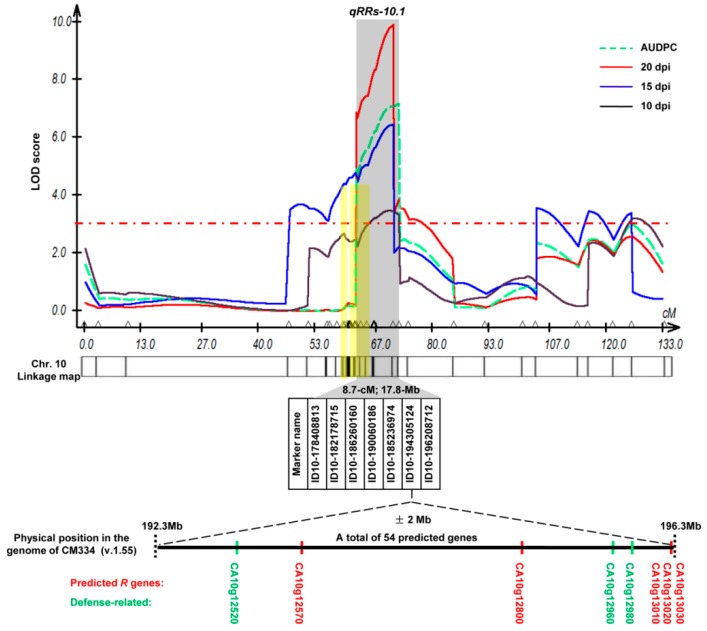
Figure 4.
Quantitative trait locus (QTL) mapping for the identification and validation of R. solanacearum resistance QTL qRRs-10.1 on pepper chromosome 10. An average 1000 permutation threshold (maximum log-likelihood = 3.0) is indicated by the dotted line. The above QTL graph was the original graph generated by WinQTL cartographer with the following modification. A QTL involved in each resistance component (DSI at 15 and 20 dpi, and AUDPC) was mapped to an overlap region, indicated with the gray bar. The approximate positions of the two resistance-associated regions identified by SLAF-BSA are indicated by the yellow bars. The bar below the QTL graph represents the genetic linkage map constructed with 46 InDel and SNP markers on chromosome 10. InDel markers within the resistance QTL qRRs-10.1 are shown. The five predicted resistance (R) genes and three defense-related genes are shown in red and green, respectively.

