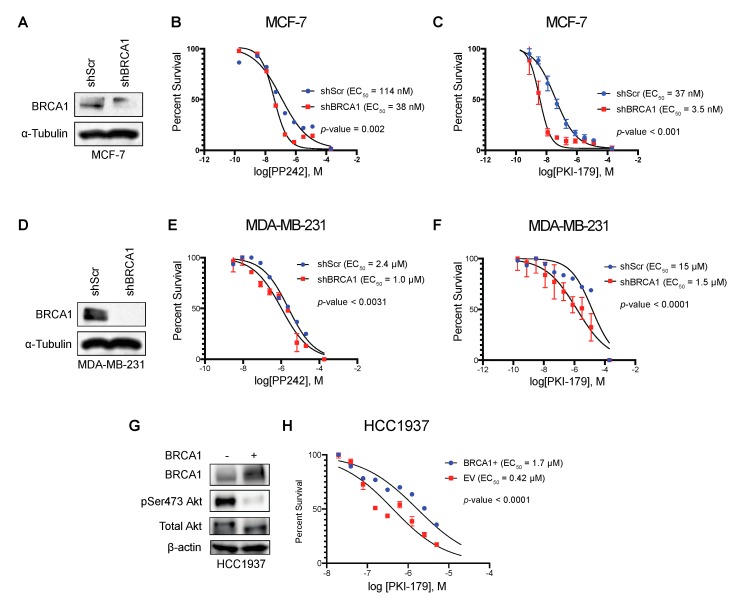
Figure 5.
Breast cancer cells with BRCA1 loss are sensitive to mTOR inhibition. (A) Western blot displaying confirmation of BRCA1 knockdown in MCF-7 cells; (B) sigmoidal curve representing the percentage of survival from the cell viability assay used to determine the half maximal effective concentration (EC50) of PP242 in MCF-7 cells (n = 3 independent experiments); (C) sigmoidal curve representing the percentage of survival from the cell viability assay used to determine the half maximal effective concentration (EC50) of PKI-179 in MCF-7 cells (n = 3 independent experiments); (D) Western blot displaying confirmation of BRCA1 knockdown in MDA-MB-231 cells; (E) sigmoidal curve representing the percentage of survival from the cell viability assay used to determine the half maximal effective concentration (EC50) of PP242 in MDA-MB-231 cells (n = 3 independent experiments); (F) sigmoidal curve representing the percentage of survival from the cell viability assay used to determine the half maximal effective concentration (EC50) of PKI-179 in MDA-MB-231 cells (n = 3 independent experiments); (G) Western blot displaying confirmation of BRCA1 overexpression in HCC1937 cells; (H) Sigmoidal curve representing the percentage of survival from the cell viability assay used to determine the half maximal effective concentration (EC50) of PKI-179 in HCC1937 cells with and without full length BRCA1 (n = 3 independent experiments).

