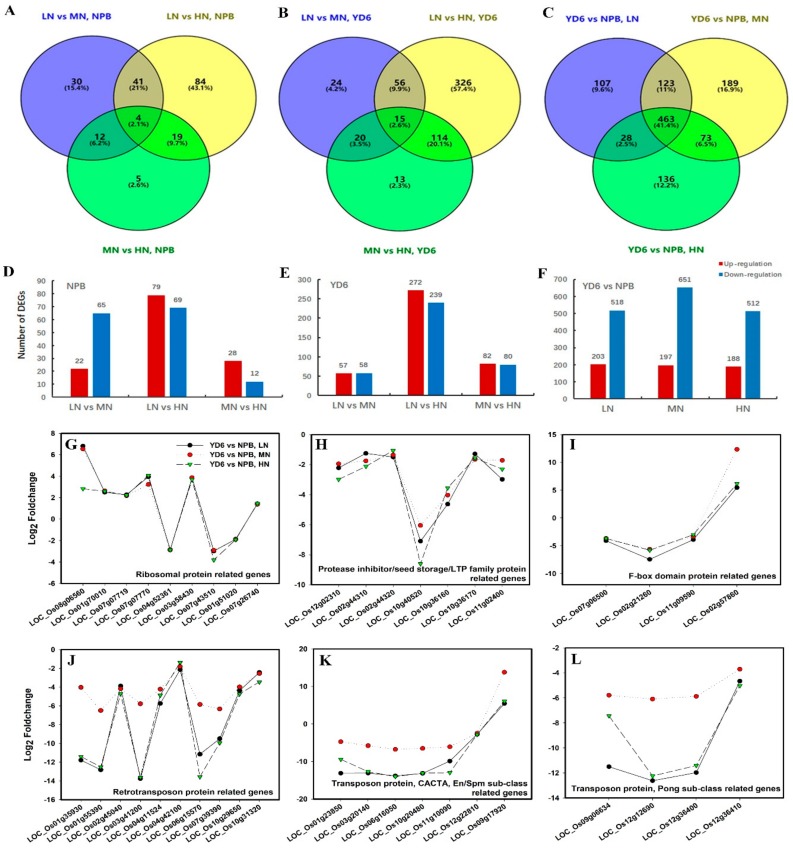
Figure 5.
Profiles of DEGs between the comparisons. (A,D) DEGs in response to N rate in NPB; (B,E) DEGs in response to N rate in YD6; (C,F) DEGs between the varieties; (G–L) Fold changes of DEGs related to ribosomal protein (G), Protease inhibitor/seed storage/LTP family protein (H), F-box domain protein (I), retrotransposon protein, transposon protein (J), CACTA, En/Spm sub-class protein, transposon protein (K), Pong sub-class protein (L).

