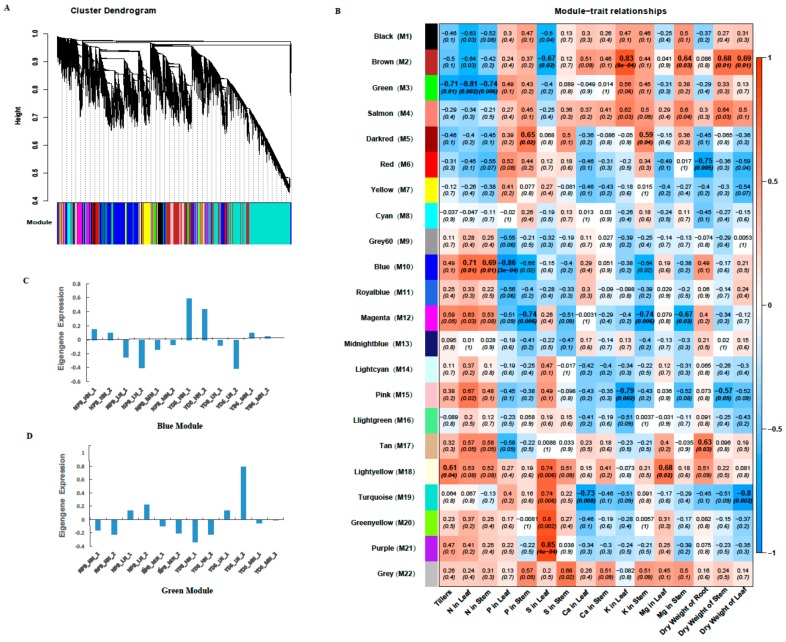
Figure 7.
Weighted gene co-expression network analysis (WGCNAs) of gene expressions and the related traits. (A) Hierarchical cluster tree showing 22 co-expression modules identified by WGCNAs. Each branch in the tree represents an individual gene; (B) Matrix of module – trait correlation: A total of 22 modules shown on the left and the relevance color scale from −1 to 1 is on the right. The numbers in parentheses represent the significance (p), and the numbers above represent the correlation coefficient (r). The eigengene expression profile in blue module (C) and green module (D).

