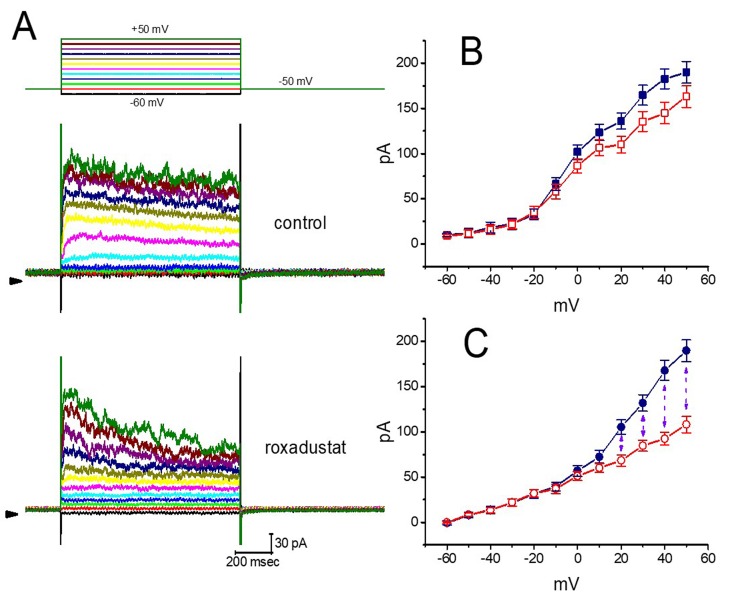
Figure 4.
Averaged current–voltage (I–V) relationships of IK(DR) taken with or without roxadustat addition. In these experiments, the examined cells were maintained at −50 mV and a series of voltage pulses from −60 to +50 mV in 10-mV increments were applied at a rate of 0.1 Hz. (A) Representative IK(DR) traces obtained in the absence (upper) and presence (lower) of 3 μM roxadustat. The upper part indicates the voltage protocol applied and the arrowhead shown in the left inside each panel is the zero current level. Calibration mark in the right lower corner applies to all panels. (B) Averaged I–V relationships of IK(DR) in the control (i.e., in the absence of roxadustat). Current amplitudes at different levels of voltage were measured at the beginning (■) and end (□) of voltage steps. (C) Averaged I–V relationships of IK(DR) in the presence of 3 μM roxadustat. Current amplitudes at different levels of command steps were measured at the beginning (●) and end (○) of voltage steps. Each point shown in (B) and (C) indicates the mean ± SEM (n = 9). The vertical dashed line shown in (C) indicates considerable difference between peak and late IK(DR) as cells were exposed to 3 μM roxadustat.

