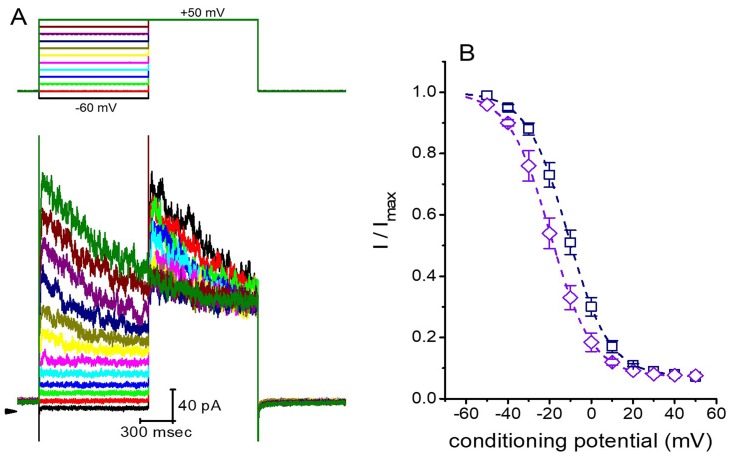
Figure 5.
Effect of roxadustat on the steady-state inactivation curve of IK(DR) in GH3 cells. These experiments were conducted in a two-step voltage clamp protocol. (A) Representative IK(DR) traces obtained in the presence of 3 μM roxadustat. The upper part denotes the voltage protocol used, and arrowhead in the left side inside panel (A) is zero current level. Calibration mark in the right lower corner applies to all current traces. (B) Steady-state inactivation curve of IK(DR) obtained in the presence of 3 μM (□) and 10 μM roxadustat (◇). Each point indicates the mean ± SEM (n = 8). The smooth curves were least-squares fitted by a Boltzmann function (detailed under Materials and Methods).

