Figure 11.
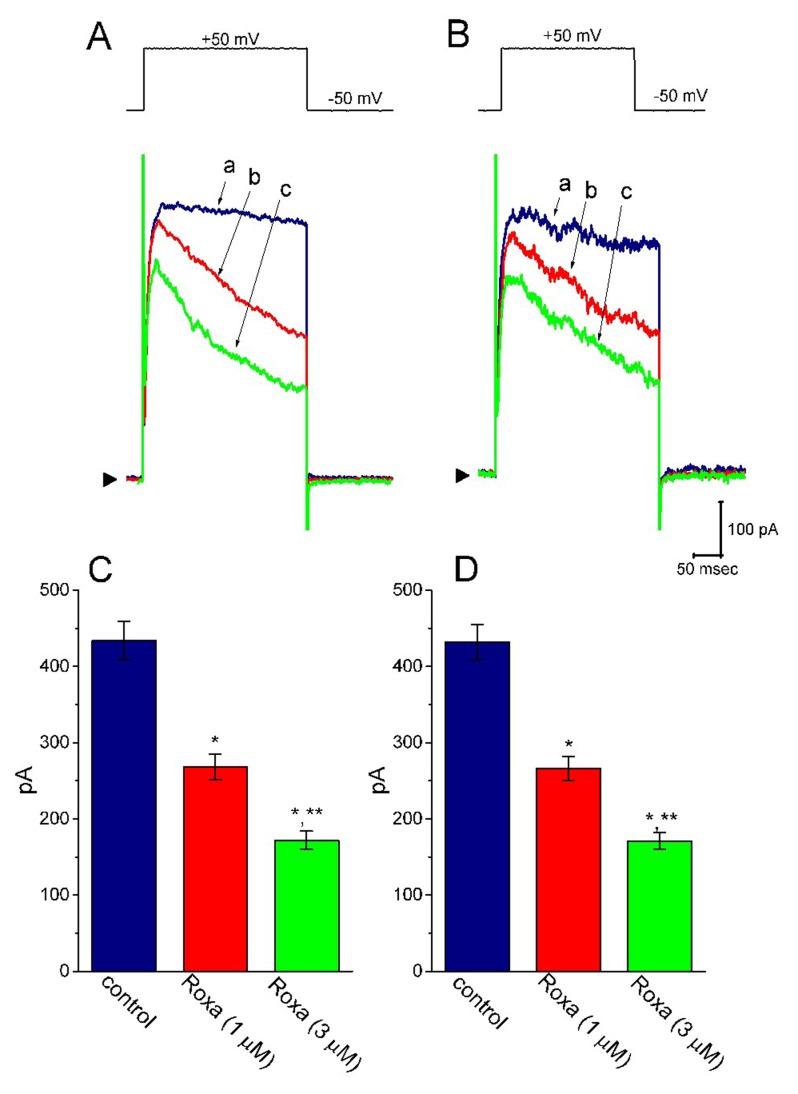
Effect of roxadustat on IK(DR) in high glucose-treated H9c2 cells. In these experiments, H9c2 cells were incubated in normal glucose (5.5 mM) or high glucose (30 mM) medium for 24 h. In (A) and (B), superimposed IK(DR) traces obtained in the control (a) and during the exposure to 1 μM roxadustat (b) and 3 μM roxadustat (c) were taken in the cell treated with normal glucose (5.5 mM) and high glucose (30 mM), respectively. The upper part in each panel denotes the voltage protocol, the calibration mark in the lower part applies all current trace, and arrowhead at the left side of currents in each panel is the zero current level. In (C,D), summary bar graphs illustrate the effects of roxadustat on the IK(DR) amplitude recorded from H9c2 cells treated with normal glucose (5.5 mM) and high glucose (30 mM), respectively (mean ± SEM; n = 7 for each bar). * Significantly different from control (p < 0.05) and ** significantly different from 1 μM roxadustat alone group (p < 0.05).

