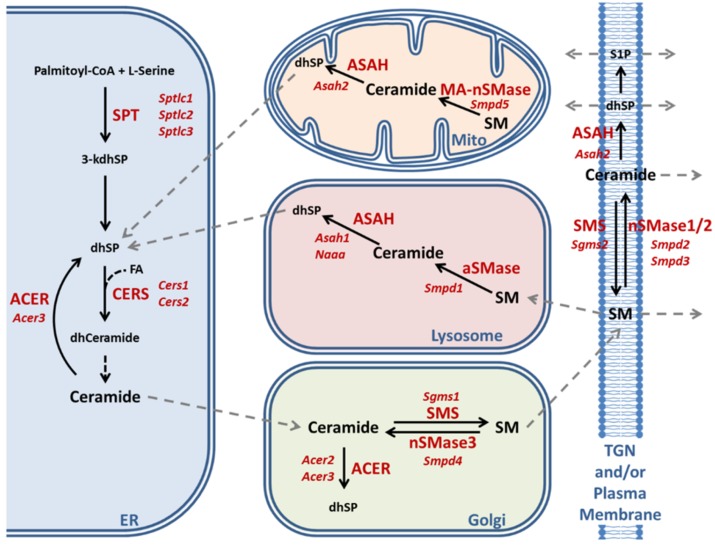
Figure 3.
Schematic representation of ceramide–sphingomyelin metabolism modified after References [107,108]. The abbreviations together with information about differential cell type expression, subcellular localizations, and substrate preference for various enzyme isoforms are listed at the end of the article.

