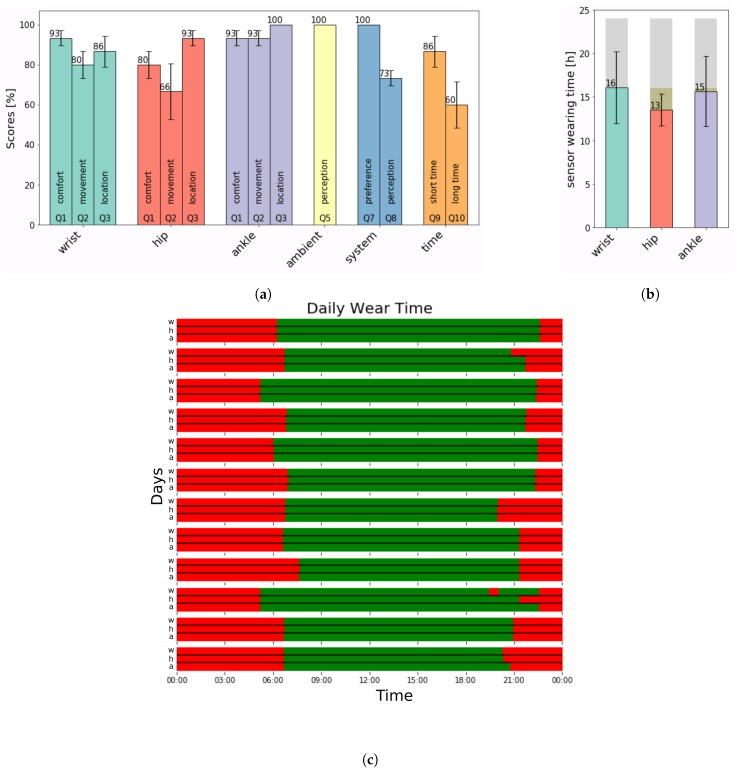
Figure 1.
Results from acceptance and adherence evaluation. (a) Answer scores from the questionnaire. The question item is depicted at the bottom of each bar. Items Q1–Q3 are repeated once for every body-worn sensor. (b) Total wearing time of the three body-worn sensors over 4 weeks. The grey bar outlines 24 h, the yellowish bar outlines the 16 h mark. (c) Example of daily sensor-wearing time over consecutive 12 days. Green is wearing time; red is non-wearing time. For every day, wrist, hip and ankle sensors are listed individually.

