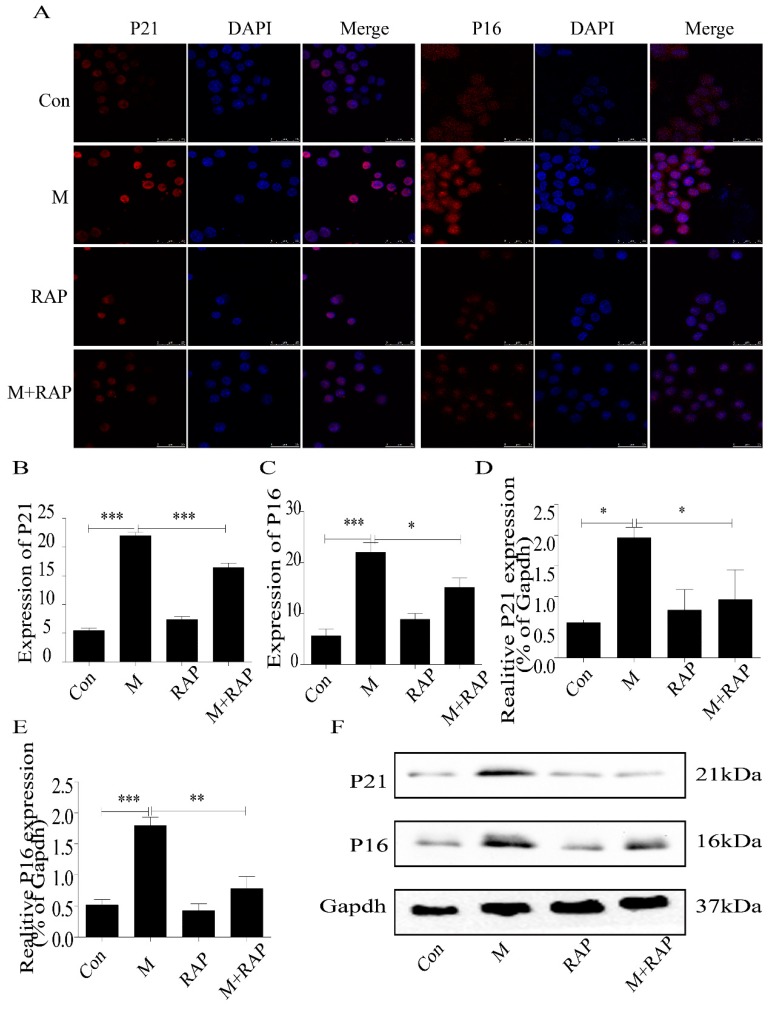
Figure 7.
Expression of P21 and P16 in macrophage cells detected by immunofluorescence and Western blot. (A) Immunofluorescence. (B,C) Results of P21 and P16 immunofluorescence. (D,E) Results of P21 and P16 Western blot. (F) Western blot. Con, control; M, model; RAP, rapamycin; M + RAP, model + rapamycin. Data are presented as means ± SD, * p < 0.05; ** p < 0.01; *** p < 0.001.

