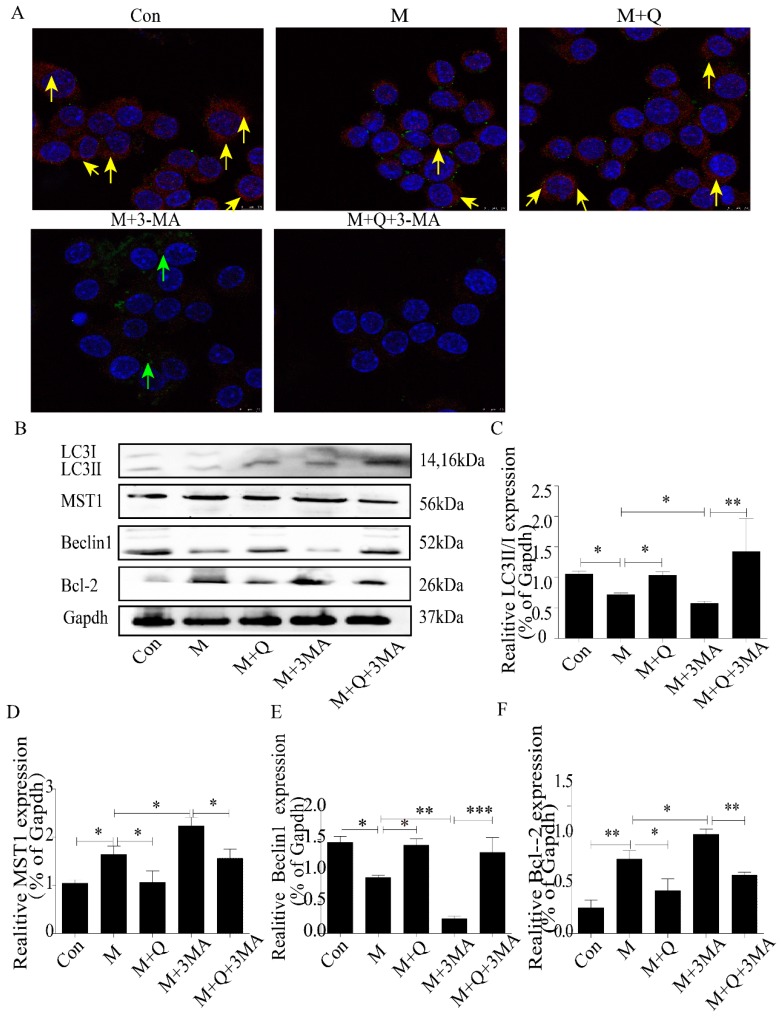
Figure 9.
Quercetin regulated MST1-mediated autophagy. (A) Immunofluorescence of LC3 and P53, colocalization of P53 and LC3 labeled by yellow arrow, green arrows represented green fluorescent P53. (B) Western blot. (C–F) Expression of LC3-Ⅱ/Ⅰ, MST1, Beclin1, and Bcl-2. Con, control; M, model; M + Q; Model + Quercetin; M + 3-MA, model + 3-Methyladenine; M + Q + 3-MA, model + quercetin + 3-methyadenine. Data are presented as means ± SD, * p < 0.05; ** p < 0.01; *** p < 0.001.

