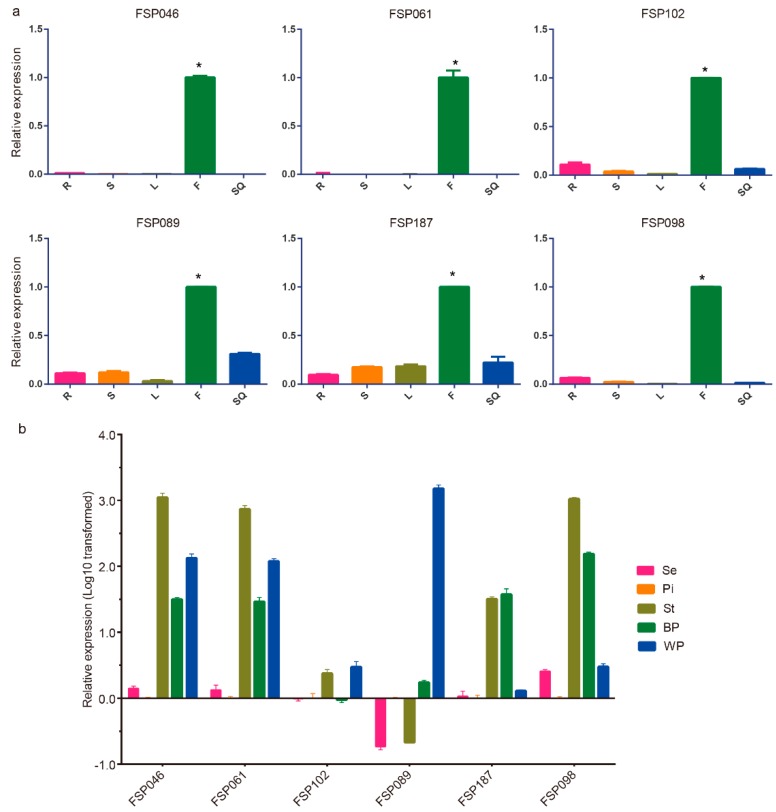
Figure 2.
Expression profiles of six flower-specific candidate genes in different tissues by quantitative real-time transcription-PCR (qRT-PCR) analysis. (a) Expression patterns of six candidate genes in five different tissues. R (root), S (stem), L (leaf), F (flower bud), SQ (silique). The asterisk indicates that the expression value in the flower bud was at least three times higher than that in other tissues. (b) Expression profiles of six flower-specific candidate genes in dissected flower parts. The relative expression values were log10 transformed. Se (sepal), P (pistil), St (stamen), BP (blossomy petals), WP (wilting petals). Tissues from five plants were collected together, three technical repeats were performed and three biological repeats were conducted. The B. napus β-actin gene (AF111812) was used as a reference standard.

