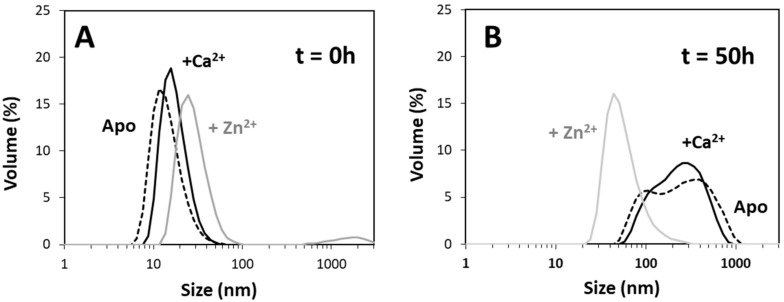
Figure 3.
Dynamic light scattering analysis of soluble Tau oligomers. The distribution of particles in solution was analyzed in the beginning of heparin-induced aggregation of 50 µM Tau (A) and after 50 h at the plateau stage (B). Before each measurement samples were centrifuged (34,000× g, 10 min.) and supernatants of the different tested conditions analyzed: apo Tau (dotted line), in the presence of calcium (black line) and in the presence of zinc (grey line). Conditions for the aggregation reaction as those in Figure 1 (see materials and methods for details).

