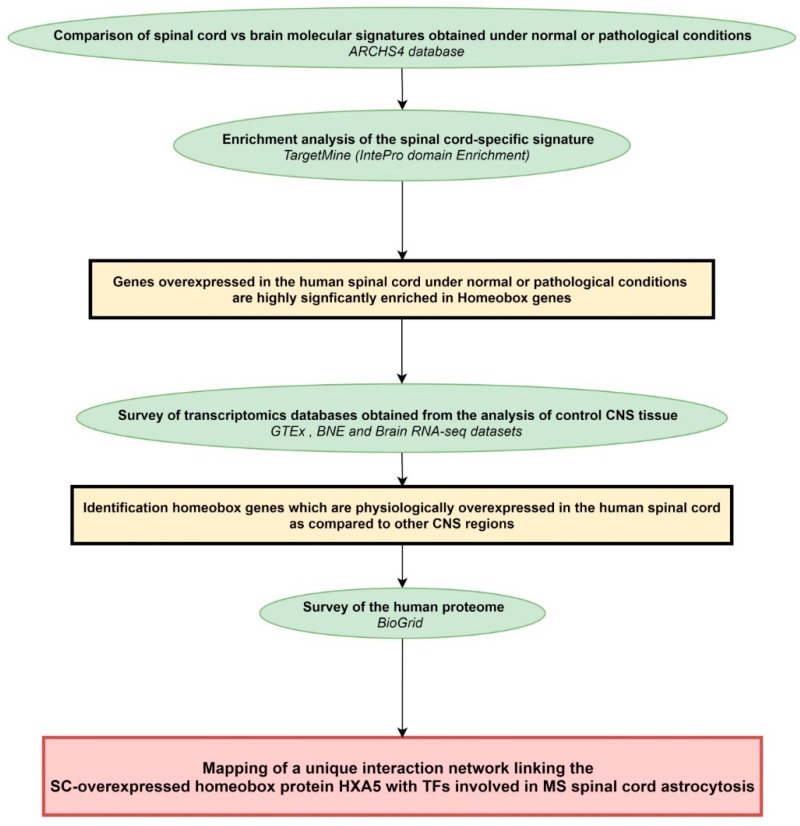
Figure 4.
Workflow of the study. Rectangles in yellow or red frame the main results obtained following each of the analytical steps briefly described in green ellipse shapes. Terms in italics correspond to the name of the bioinformatics tools used for each analytical step. BNE: Brain Net Europe; GTEx: genome-tissue expression; SC: spinal cord; TFs: transcription factors.

