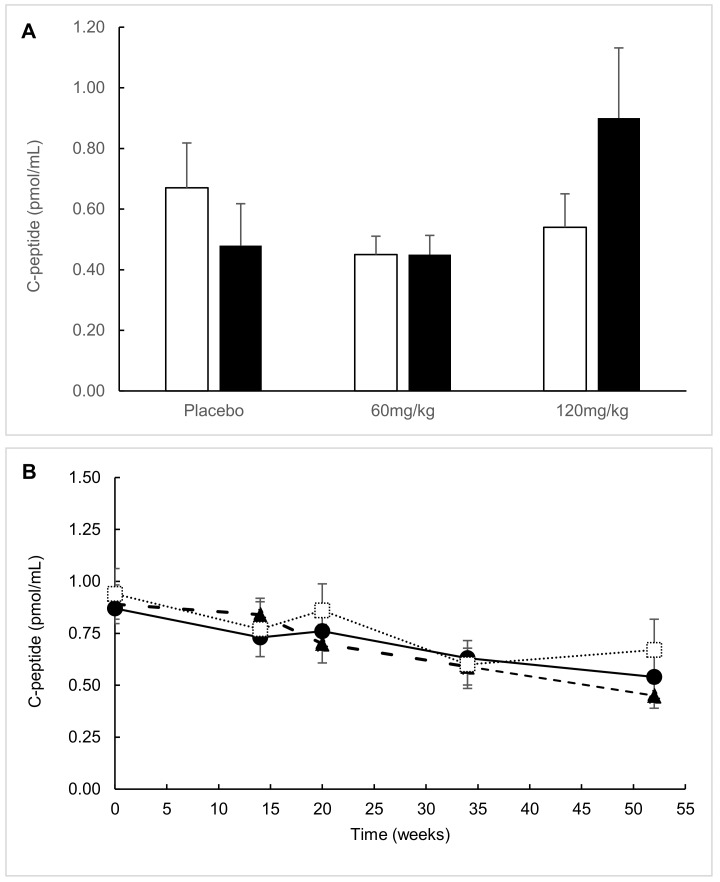
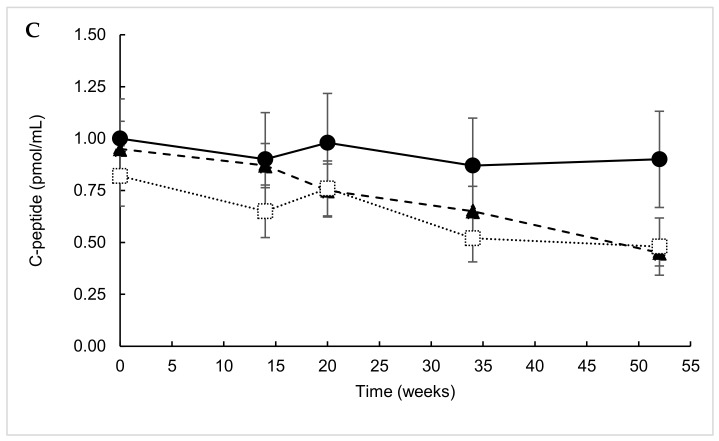
Figure 2.
C-peptide area under the curve (AUC) stratified by treatment group. (A) C-peptide AUC at the study’s end (52 weeks) in the intention-to-treat (ITT) population versus the 12–18-year subgroup. White bars = ITT analysis and black bars = 12–18-year subgroup. (B) C-peptide AUC during the study in the ITT population. Dotted line = placebo group, dash–dot line = AAT-60 mg/kg group, and solid line = AAT-120 mg/kg group. (C) C-peptide AUC during the study in the 12–18-year subgroup. Dotted line = placebo group, dash–dot line = AAT-60 mg/kg group, and solid line = AAT-120 mg/kg group.


