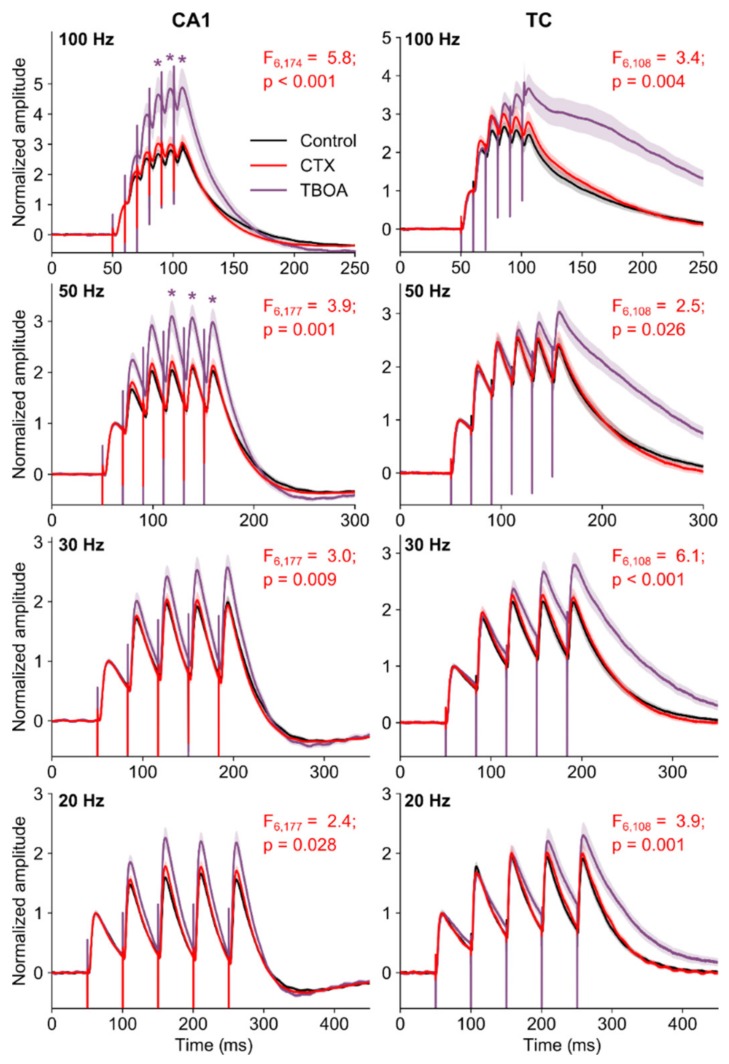
Figure 5.
The summation of EPSPs in pyramidal neurons in hippocampus (CA1) and temporal cortex (TC). Graphs show averaged responses across all neurons (control, n = 12; CTX-treated, n = 14; TFB-TBOA, n = 12). A shadow represents the standard error of the mean. The effects of CTX treatment (CTX) and application of TFB-TBOA on the amplitude of EPSP summation was tested with a repeated measures ANOVA following Tukey’s HSD (honestly significant difference) post hoc test: *—p < 0.05 between control and TFB-TBOA-treated slices.

