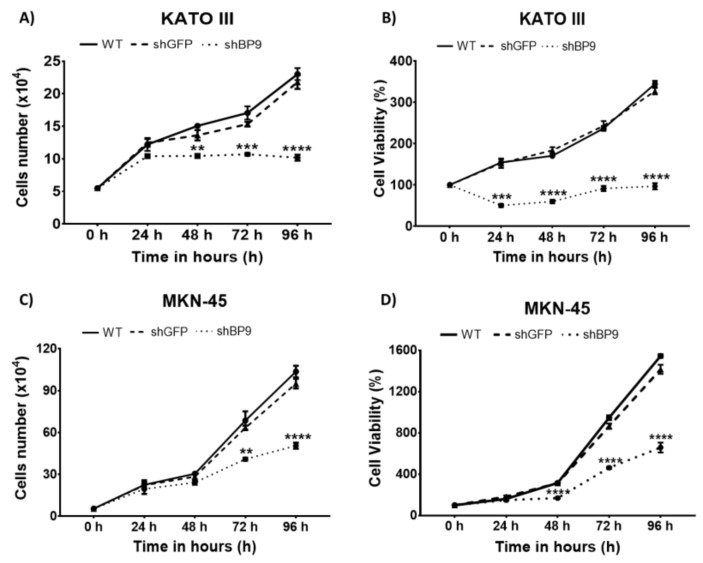
Figure 3.
Effect of knocking down TASK-3 on cell proliferation and viability. (A,C) Proliferation curves of wild-type (WT) KATO III and MKN-45 cells, or the same cells transduced with shRNAs against GFP (shGFP) or TASK-3 (shBP9) after 0, 24, 48, 72, and 96 h of incubation. (B,D) Cell viability curves as a percentage of viability of KATO III and MKN-45 cells under the indicated conditions following an incubation of 0, 24, 48, 72, and 96 h. Error bars represent the mean ± SEM of three independent experiments. ** p < 0.01, *** p < 0.001, **** p < 0.0001, compared with WT based on ANOVA followed by Tukey’s post-test.

